
Introduction
A MOM incident cost calculator reveals what most Singapore employers never see on their balance sheets: the financial cost of workplace accidents in Singapore extends far beyond the WICA payout cheque and the MOM fine. For every dollar recorded under “claims” or “legal expenses,” there are three to eight more dollars bleeding quietly from your operations-through lost productivity, insurance premium hikes, missed tenders, and workforce disruption that no single invoice will ever capture.
This article is written for Managing Directors, CFOs, and Risk Managers in Singapore’s construction, manufacturing, and industrial sectors-the leaders who sign off on budgets, negotiate insurance renewals, and answer to Boards when profit margins erode. If you have ever looked at the direct costs of a workplace accident and assumed that was the full picture, the data presented here will challenge that assumption with hard numbers.
The invisible cost of a serious work accident is typically 3–8 times higher than the direct WICA compensation, MOM fines, and medical bills combined. A structured workplace incident cost calculator helps you quantify this financial exposure in Singapore dollars, using local legislation, real multipliers, and your own operational data.
This article covers:
-
The difference between direct costs, indirect costs, and long-tail costs of a MOM-reportable accident
-
How a structured incident cost calculator translates safety risk into dollars and cents
-
The data inputs needed from finance, HR, and operations to build a robust model
-
A fully worked example of a serious injury on a Singapore construction site in 2026
-
A practical checklist to brief your management team or Board on the true cost of workplace incidents
Understanding the “Invisible” Cost of a Work Accident
MOM statistics highlight fatalities and major injuries-and rightly so. But behind every headline number lies a cascade of financial consequences that company balance sheets absorb over months and years. According to MOM’s 1H2026 WSH report, Singapore’s fatal injury rate rose to 1.1 per 100,000 workers, while the construction sector’s combined fatal and major injury rate stood at 24.1 per 100,000 workers. These are not abstract statistics-each incident triggers a chain of costs that most companies only partially track.
The total cost of a work accident is the sum of direct, indirect, and long-tail financial consequences to the employer. Understanding all three layers is essential for any MD or CFO concerned about cash flow, tender eligibility, insurance renewals, and long-term profitability.
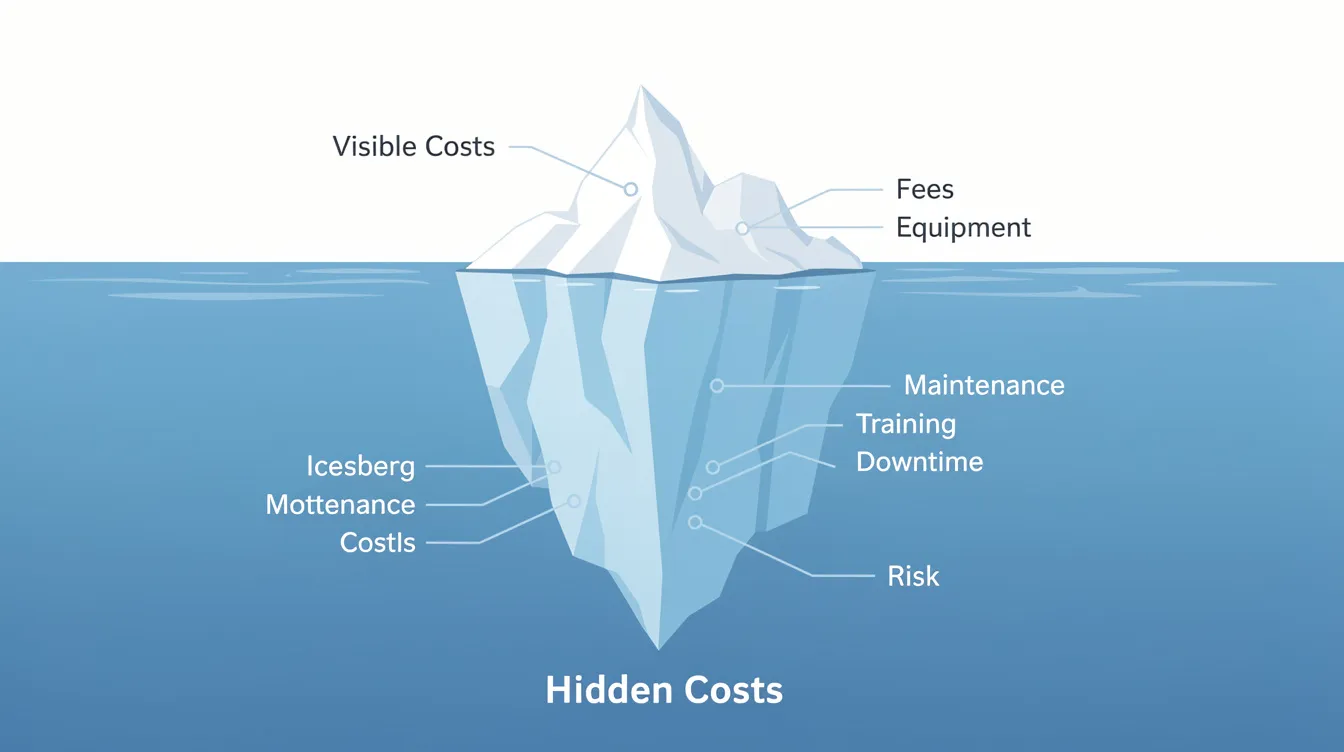
Direct Costs: The Tip of the Iceberg
Direct costs are the visible, recorded expenses that appear on invoices and in claims registers: WICA compensation payments, medical bills, emergency transport, MOM fines under the WSH Act, and immediate property damage to equipment or structures. These are relatively easy for finance teams to identify because they sit in clearly defined general ledger accounts-claims, legal fees, repairs.
To ground these figures in reality, consider the WICA compensation limits effective from 1 November 2025: death compensation caps at S$269,000 (minimum S$91,000), permanent incapacity at up to S$346,000, and medical expenses at S$53,000 or expenses incurred within one year, whichever is lower. MOM fines under the WSH Act can add tens of thousands of dollars on top-sometimes exceeding S$80,000–S$100,000 for serious breaches.
Globally, OSHA estimates employers pay nearly $1 billion weekly for direct costs related to workplace injuries. Direct costs average $40,000 to $150,000 per recordable injury, depending on claim severity and injury type. Most commercial incident cost calculators start with these direct figures as their base input-but stopping here means capturing only a fraction of the real cost.
Indirect Costs: Productivity, Disruption, and People Impacts
Indirect costs are the financial impacts that are not typically allocated to the accident in accounting systems: project delays, rework from inexperienced replacement workers, overtime to recover lost schedule, recruitment and training of replacements, management and administrative time spent on incident investigation, reduced employee morale, and quality escapes.
Research consistently shows that indirect costs can be 4 to 10 times higher than direct costs. A typical workplace accident’s hidden (indirect) costs are often larger than direct medical expenses. The full cost of a workplace incident can exceed direct costs by 200% to 300%, and in high-disruption scenarios involving serious injury or permanent incapacity, the multiplier climbs further.
Consider these concrete examples of indirect costs in a Singapore construction context:
-
Lost productivity when a 12-person crew is stood down for a three-day MOM investigation-wages still payable, project milestones still ticking
-
Overtime and weekend work costing S$30,000–S$50,000 to catch up on a delayed BCA-regulated project milestone
-
Recruitment agency fees of S$10,000–S$20,000 when a skilled crane operator or rigger cannot return to work, plus weeks of reduced output from the replacement
-
Incident investigation time consuming 40–80 hours of senior management and safety officer attention-administrative time that disrupts normal business operations
Injury-related productivity losses can also arise from reduced efficiency of co-workers assisting the injured employee or handling work stoppage procedures. Lost productivity from an injured worker and colleagues frequently exceeds direct costs. Unlike medical bills and fines, these costs are rarely coded to “accident” GL accounts, which is precisely why MDs and CFOs underestimate them.
Long‑Tail Costs: EMR, Insurance, and Reputation Over 3–5 Years
Long-tail costs are financial consequences that emerge months or years after the workplace accident: insurance premium increases, stricter underwriting terms, lost tender opportunities, and reputational damage that affects client relationships, staff retention, and financing terms.
Hidden costs related to accidents might reflect in future insurance premium spikes. Insurance premiums typically increase 20% to 50% after a claim. A high EMR (Experience Modification Rate) can increase workers’ compensation premiums by 20–30%, and a single significant claim can affect EMR for four years. One case from Howden Singapore documented a client facing a quoted premium increase of S$800,000 due to accumulated work injury claims.
Repeated MOM-reportable incidents also affect:
-
Tender eligibility: Under the Safety Disqualification (SDQ) Framework, contractors with poor WSH performance can be disqualified from public sector tenders entirely. For projects above S$1 million, safety-related criteria must be weighted at 5% of the overall PQM score or 15% of the Quality component-whichever is higher.
-
Client pre-qualification: SP Group, for example, requires contractors’ safety performance to account for at least 10% of total tender evaluation score. Workplace accidents can lead to reputational damage and long-term financial impacts on client relationships.
-
Financing risk: Banks and financiers increasingly view safety performance as an operational risk factor during loan renewals.
A robust MOM incident cost calculator must bring all three layers-direct, indirect, and long-tail-into a single, defensible financial view. Only then does the full picture of workplace safety’s financial impact become visible to decision-makers.
From MOM Reporting to a Full Incident Cost Model
MOM’s statutory incident reporting system captures essential compliance data: who was injured, how, and what compensation is owed. But compliance reporting and financial modelling serve different purposes. CFOs need a decision tool that quantifies the revenue impact of workplace incidents and builds a case for prevention investment-not just a record of what happened.
What the MOM Numbers Tell You (and What They Miss)
Every MOM-reportable incident generates an incident report that captures:
-
Type of injury (fatal, major, minor) and injury type classification
-
Days of medical leave and light duty for the injured worker
-
Cause, immediate work process, and hazards involved
This data is essential for regulatory compliance. But MOM data does not quantify:
-
The actual cost of a MOM stop work order or internal work stoppage, including idle wages, equipment rental running costs, and schedule penalties. Understanding the true cost of a stop work order requires a separate financial analysis.
-
Cost of schedule penalties or liquidated damages under SIA or PSSCOC construction contracts
-
Brand damage from media coverage, social media backlash, or client perception shifts
A financial cost calculator must enrich MOM data with inputs from finance, HR, and operations to estimate the real cost to the business.
Key Inputs for a Singapore‑Focused Incident Cost Calculator
Before running any calculation, CFOs and Risk Managers should assemble the following data:
-
Headcount by role and average fully-loaded salary (including CPF contributions, allowances, overtime rates)
-
Average daily revenue or contract value per operating day for major projects currently underway
-
Existing WICA and WSH insurance premiums and claims history for the last three years
-
Typical profit margin (net profit as percentage of revenue) for your business line-5% is common for construction and manufacturing SMEs
-
Recent MOM cases: number of reportable and non-reportable accidents in the last three years, accessible through your incident reporting records
-
Tender history: recent bids where safety performance scores or bizSAFE tier were evaluation factors
These inputs allow the calculator to translate lost time, overtime, and insurance increases into dollar amounts specific to your company-not generic international averages.
How Multipliers and Benchmarks Fit In
The indirect cost multiplier is a ratio applied to direct costs to estimate hidden financial impacts. International tools like OSHA Safety Pays use broad multipliers, typically suggesting indirect costs can be 4 to 10 times higher than direct costs. However, actual costs vary significantly depending on context.
Singapore firms should calibrate multipliers based on:
-
Industry: A petrochemical facility with complex permit-to-work systems faces different disruption profiles than an SME fabrication workshop
-
Incident severity: A near miss generates almost no direct costs but still consumes investigation and administrative time; a permanent incapacity case triggers massive long-tail consequences
-
Safety maturity: Companies with bizSAFE certification have lower incident rates and typically face lower multipliers (2–4×) because their incident management systems contain disruption more effectively. Firms with no formal system may see multipliers of 6–10×.
A well-designed MOM incident cost calculator should let users override default multipliers with their own historical data where available-estimates based on actual past incidents are always more credible than generic benchmarks.
Once inputs and multipliers are defined, the calculation process is straightforward and repeatable.
Designing and Using a MOM Incident Cost Calculator
At MOSAIC Ecoconstruction Solutions, we build and use incident cost calculators when advising clients on bizSAFE upgrades, ISO 45001 implementation, and WSH investment decisions. The MOM provides a structured six-section framework for estimating costs of workplace incidents, and our approach extends this into a practical financial tool.
The goal is not mathematical perfection. It is a conservative, credible estimate that CFOs can defend in Board and Audit Committee discussions.
Step‑by‑Step Calculation Method
Step 1 – Define the incident scenario
Specify the incident type clearly. Example: “Major injury in 2026 to a 38-year-old rigger on a Jurong construction site, 180 days of medical leave, 90 days of light duty, one-day MOM stop work order.” Confirm whether the incident is MOM-reportable and WICA-compensable.
Step 2 – Calculate direct costs
Sum all visible expenses: WICA compensation (based on earnings, age, and incapacity percentage), medical expenses (up to the S$53,000 cap), emergency transport, property damage and damaged equipment, immediate legal fees, and MOM fines. Total these into a single “Direct Cost” figure.
Step 3 – Estimate indirect costs
Quantify lost workdays for the injured employee, line supervisor, safety officer, and witnesses involved in incident investigation. Add overtime costs, retraining expenses, temporary hire fees, and rework or scrap from inexperienced replacements. Indirect costs may include administrative time for accident investigations. Employers should also consider recruiting and training costs for replacement workers following incidents. If the company lacks detailed historical data, apply an incident-type multiplier: 3× direct costs for serious injuries, up to 8× for incapacitating injuries with high operational disruption.
Step 4 – Model long-tail costs
Estimate insurance premium increases over the next three policy years. For example, a 25% increase on a S$200,000 annual premium equals S$50,000 per year × 3 years = S$150,000. Quantify lost tender opportunities by referencing recent bids where safety scores were decisive-a single disqualification from a S$5–10 million contract can dwarf all other costs combined. Include reputational-driven impacts such as higher staff turnover or recruitment difficulty, with conservative probability adjustments.
Step 5 – Translate total cost into required additional revenue
Sum direct + indirect + long-tail costs. Divide total cost by your company’s net profit margin to reveal how much additional revenue is needed to absorb one major accident. For example, S$400,000 in total incident cost at a 5% profit margin = S$8 million in additional revenue required just to break even. For every $1 invested in safety, employers see $4 to $6 return-making workplace safety investments far more cost-effective than absorbing the consequences of accidents.
Step 6 – Compare against prevention and safety investment
Set the total incident cost against planned spending on WSH training, bizSAFE/ISO projects, engineering controls, or outsourced EHS manpower. BizSAFE Level 3 certification costs between $1,200 and $5,300-a fraction of what a single serious incident costs. A single serious incident can cost $200,000 to $600,000 or more, meaning one avoided incident can pay for several years of safety investment.
Comparing “Minimal” vs “Full” Costing Approaches
Many firms calculate incident cost using only a “minimal” approach-totalling invoices and claims. A MOM incident cost calculator uses a “full” approach that captures the complete financial impact.
|
Criterion |
Minimal Approach |
Full Costing Approach |
|---|---|---|
|
Cost categories included |
Medical bills, WICA payouts, fines |
Bills + productivity loss + insurance increases + tender impact + reputation |
|
Time horizon |
0–3 months |
0–5 years |
|
Indirect cost multiplier applied |
None |
3–8× direct costs depending on incident severity |
|
Decision usefulness for MD/CFO |
Low-underestimates financial exposure |
High-supports budget defence and strategic planning |
|
Insurance negotiation value |
Minimal |
Significant-enables informed premium discussions |
While minimal costing is easier, it leads to chronic under-investment in prevention because it understates the actual costs. Calculating hidden costs requires assessing operational disruption and business effects beyond what appears on a single invoice.
To see the gap in real numbers, we walk through a realistic Singapore scenario next.
Visualising Costs: Graphs, Timelines, and “Iceberg” Diagrams
Effective communication of accident cost data to non-finance stakeholders requires strong visuals:
-
Iceberg graphic: A small visible tip above the waterline (direct costs: WICA payouts, fines, medical expenses) and a massive hidden base below (indirect costs and long-tail costs: productivity loss, insurance increases, lost tenders, reputation damage)
-
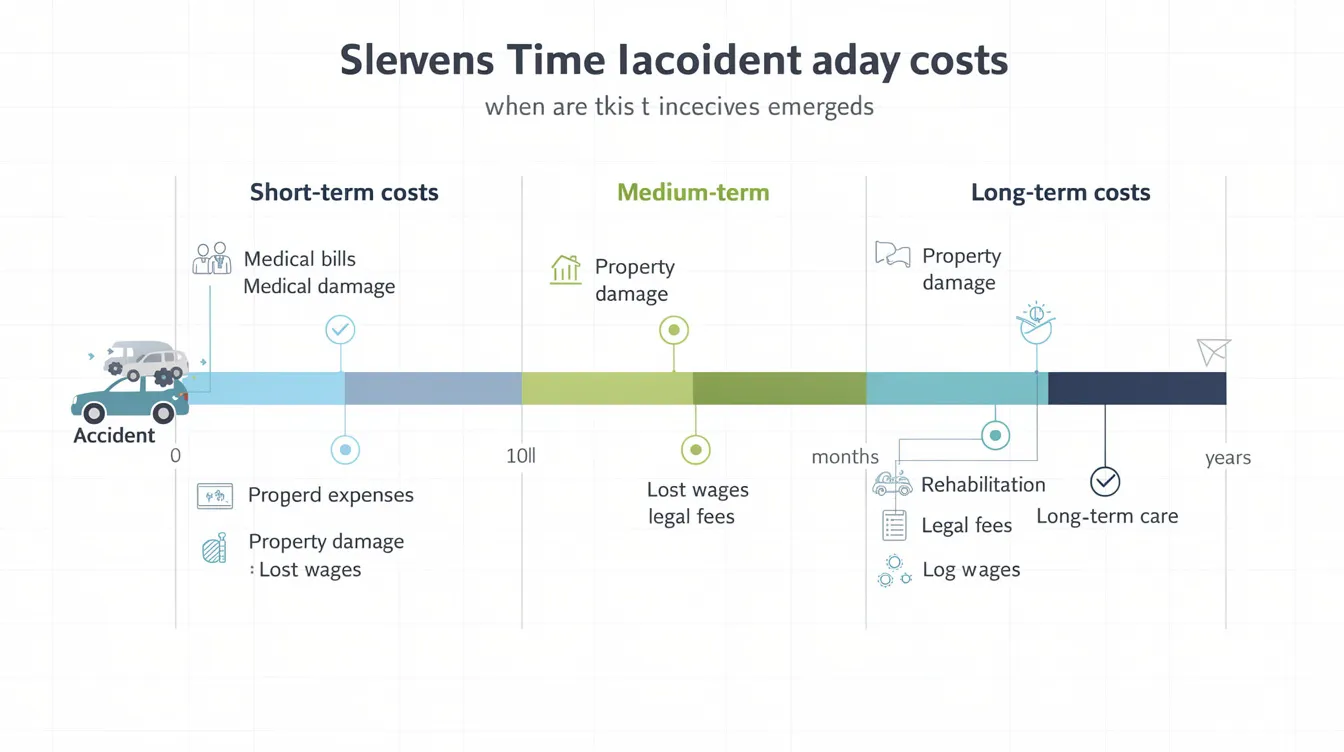
Timeline chart: Showing when cash outflows occur-Week 1 (medical bills, emergency response), Months 1–3 (lost productivity, overtime, incident investigation), Years 1–3 (premium hikes, tender scoring impact)
-
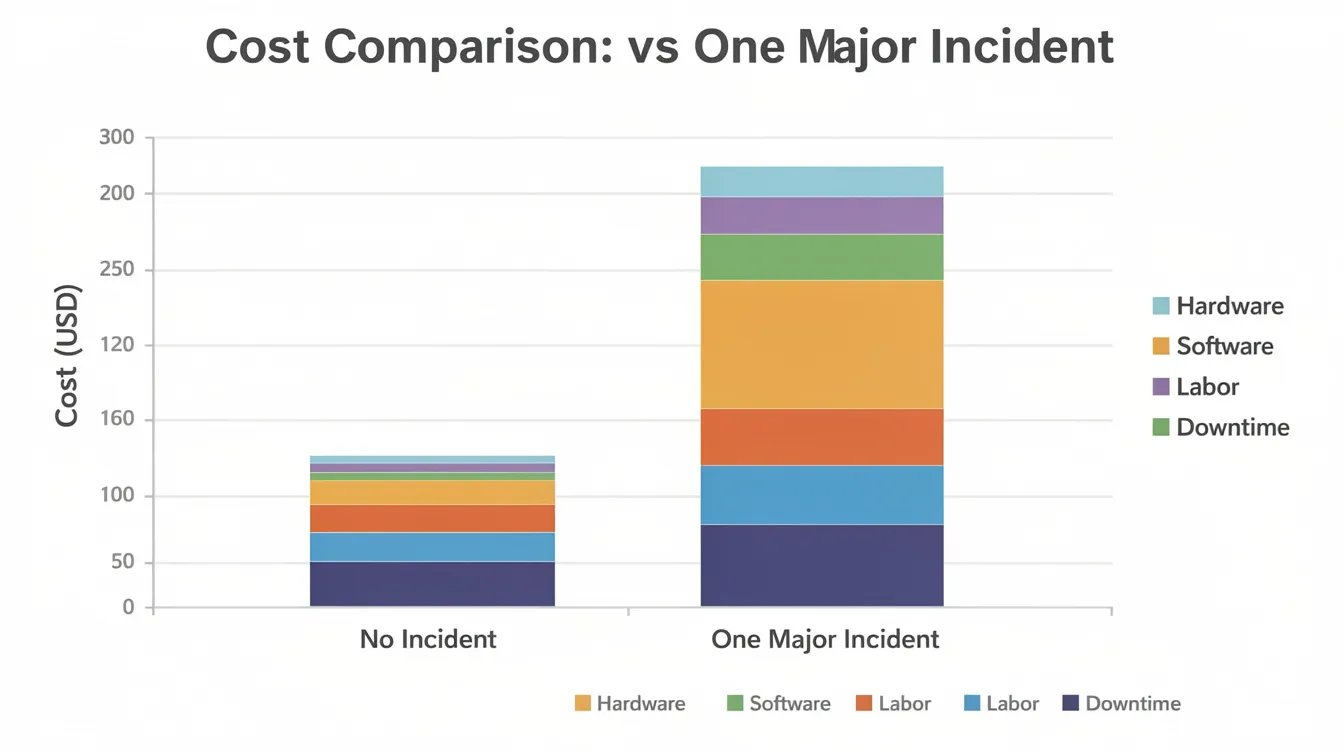
Stacked bar chart: Comparing a “no incident scenario” versus a “one major incident scenario,” with direct, indirect, and long-tail cost layers clearly separated
These visuals help project managers, safety officers, and operations leaders understand why MDs and CFOs treat workplace safety as a strategic financial concern rather than a compliance checkbox.
A Worked Example: How One MOM‑Reportable Accident Multiplies in Cost
This section walks through a realistic 2026 scenario for a medium-sized Singapore construction firm with approximately 150 employees. The numbers are illustrative but grounded in current WICA limits, MOM enforcement trends, and typical industry assumptions. A $15,000 claim can cost a business $123,500 in total when all layers are accounted for-and the scenario below involves far more than a $15,000 claim.
Scenario Setup: 2026 Major Injury on a Construction Site
-
Company: 150-employee main contractor in Singapore, annual revenue S$35 million, net profit margin 5%
-
Incident date: 14 March 2026, fall from height at a Tampines HDB construction site
-
Outcome: Non-fatal, permanent partial incapacity (40%), 120 days medical leave, 90 days light duty, 2-day MOM stop work order
-
Injured worker: 38-year-old rigger, monthly earnings S$3,200
These assumptions are stated clearly so you can adapt them for your own calculator inputs using your company’s actual data.
Calculating Direct Costs in the Example
|
Cost Item |
Amount (S$) |
|---|---|
|
WICA compensation for permanent partial incapacity (based on earnings, age, incapacity %) |
210,000 |
|
Medical expenses paid (out of S$53,000 cap) |
40,000 |
|
Emergency transport and immediate incident response |
2,500 |
|
Property damage (scaffolding, tools, damaged equipment) |
12,000 |
|
MOM fine under WSH Act after investigation |
80,000 |
|
Direct Cost Subtotal |
344,500 |
This S$344,500 is what most companies stop at. It is the figure that appears in the claims register and on the CFO’s incident summary. But it represents a fraction of the full cost.
Adding Indirect and Long‑Tail Costs
Indirect costs:
|
Cost Item |
Amount (S$) |
|---|---|
|
2-day MOM stop work order: lost revenue |
70,000 |
|
Wages for idle workers during work stoppage |
18,000 |
|
Overtime and weekend work to recover schedule slippage |
35,000 |
|
Recruitment and training of replacement worker |
15,000 |
|
Management, safety team, and administrative time (investigation, audit, client meetings) |
25,000 |
|
Rework from reduced quality during transition period |
12,000 |
|
Indirect Cost Subtotal |
175,000 |
Long-tail costs:
|
Cost Item |
Amount (S$) |
|---|---|
|
Insurance premium increase: S$220,000/year → S$275,000/year for 3 years |
165,000 |
|
Lost tender opportunity: disqualification from one S$8M tender; estimated foregone profit S$400,000 × 50% probability |
200,000 |
|
Increased recruitment difficulty and staff turnover costs (estimated over 12 months) |
45,000 |
|
Long-Tail Cost Subtotal |
410,000 |
Combined totals:
|
Cost Category |
Amount (S$) |
|---|---|
|
Direct costs |
344,500 |
|
Indirect costs |
175,000 |
|
Long-tail costs |
410,000 |
|
Total Incident Cost |
929,500 |
The direct and indirect costs combined already exceed S$519,500. When long-tail costs are layered in, the total approaches S$930,000-a cost multiplier of approximately 2.7× the direct costs alone. In scenarios involving fatalities, permanent total incapacity, or higher-profile media coverage, multipliers of 5–8× are documented.
Revenue impact: At a 5% profit margin, this single accident requires S$929,500 ÷ 0.05 = S$18.59 million in additional revenue to recover the financial impact. For a S$35 million company, that is more than half of annual revenue.
What the Example Reveals to MDs and CFOs
Three insights emerge clearly from this worked example:
-
Direct costs are less than 40% of total financial impact. The visible expenses-WICA compensation, medical bills, fines, property damage-account for S$344,500 out of S$929,500. The majority of the true cost is invisible in standard accounting.
-
Insurance and tender-related impacts extend across at least three financial years. The S$165,000 in insurance increases and S$200,000 in expected lost tender profit are not one-time hits-they compound across renewal cycles and bidding seasons.
-
Preventing one such accident has the same financial effect as landing several sizeable contracts. At 5% margin, avoiding this S$929,500 cost is equivalent to winning and delivering S$18.59 million in new revenue. Workplace safety investments are more cost-effective than absorbing the consequences of accidents.
Using a MOM incident cost calculator with this structure helps decision-makers prioritise WSH investment even during cost-cutting cycles. The numbers speak for themselves.
Building these calculations into regular risk reviews is essential-but common pitfalls exist.
Common Challenges When Calculating Accident Costs-and How to Solve Them
Many Singapore businesses attempt rough calculations in spreadsheets but encounter data gaps, double counting, or scepticism from Boards. These are practical remedies drawn from HSE consultancy experience.
Problem 1: Only Counting What Appears on Invoices
Finance teams naturally capture what they can see: WICA payouts, medical bills, MOM fines. But costs associated with workplace incidents include immediate medical treatment, investigation time, and productivity loss-and the latter two rarely appear on any invoice.
Solution: Create standard internal cost codes for “incident-related downtime,” “investigation hours,” “rework,” and “replacement training.” Tag these costs for at least 6–12 months after every major incident. Involve project managers and HR to estimate realistic hours and days for each workplace accident. Lost productivity can stem from the time it takes to address an incident and assist affected coworkers-this must be captured systematically.
Problem 2: Fear of “Speculative” Numbers
MDs and Boards often resist including tender loss or reputational damage because they feel difficult to prove. An accident’s financial impact can include fines or legal fees from safety breaches, but softer costs like reputation are harder to defend.
Solution: Use conservative probability-adjusted estimates based on documented assumptions. Present ranges (best case, most likely, worst case) rather than a single point estimate. Keep assumptions aligned with MOM and industry benchmarks-such as the WSH Institute’s finding that employers bear approximately 88% of total work injury costs-to maintain credibility. A well-documented risk management system strengthens legal positions and Board confidence in the numbers.
Problem 3: Fragmented Data Across Departments
Calculating hidden costs requires information from finance (premium histories, profit margins), HR (salaries, turnover, lost time claims), operations (project schedules, downtime), safety teams (investigation records), and insurance brokers. No single department holds the full picture.
Solution: Appoint a single “incident cost owner”-often the Risk Manager or Head of HSE-and define a standard data-collection template used after every MOM-reportable incident. Run quarterly cross-functional reviews to validate calculator outputs and refine multipliers with real data. This is a core component of effective incident management and follow up.
Problem 4: Not Linking Costs Back to Safety Investment Decisions
Some firms calculate accident cost but never connect the results to WSH budgets, training plans, or design-for-safety initiatives. The analysis sits in a file and gathers dust.
Solution: Integrate the MOM incident cost calculator into annual budget cycles and risk committees, explicitly comparing “cost of incidents last year” with “cost of proposed prevention programmes.” Convert proposed safety projects-whether bizSAFE certification, ISO 45001 implementation, or outsourced EHS manpower-into simple payback and ROI figures using calculator results. BizSAFE-certified companies often receive lower insurance premiums, and companies with bizSAFE certification have lower incident rates, making the investment case straightforward.
Conclusion and Next Steps
The visible cost of a workplace accident in Singapore-MOM fines, WICA compensation, medical expenses-is only a fraction of the total financial impact. A structured MOM incident cost calculator exposes the rest: the indirect costs of productivity loss, disruption, and people impacts; the long-tail costs of insurance increases, lost tenders, and reputational erosion. In 2017, over 100 million workdays were lost globally due to injuries-and Singapore’s own sectors face comparable proportional exposure.
MDs, CFOs, and Risk Managers need this visibility to:
-
Defend safety budgets and safety investment proposals with credible, dollar-denominated evidence
-
Negotiate smarter with insurers and main contractors using documented incident cost data
-
Protect long-term profitability and business continuity by treating workplace safety as a financial strategy, not a compliance cost
Immediate next steps:
-
Gather the 12–15 key data points outlined in this article: headcount, fully-loaded salaries, revenue per operating day, insurance premium history, profit margin, and recent incident data.
-
Build or adopt a calculator template aligned to the MOM/WICA context, including direct, indirect, and long-tail cost categories. The MOM Incident Cost Calculator helps organizations capture comprehensive financial impacts of workplace incidents and reveals operational costs that might not be visible immediately.
-
Run at least two scenarios-one based on a recent incident and one modelling a “worst-credible” event-to brief your leadership team on actual financial exposure.
-
Use results to prioritise concrete prevention measures: bizSAFE upgrades, ISO 45001 implementation, design-for-safety reviews, or outsourced safety manpower. BizSAFE certification is valid for three years, making recertification cycles a natural trigger for refreshing your cost model.
MOSAIC Ecoconstruction Solutions supports organisations by customising a MOM incident cost calculator to their portfolio and risk profile, and designing targeted WSH programmes that deliver the highest financial risk reduction per dollar spent.
Additional Resources and Tools
This section provides non-essential but valuable references for readers who want to deepen their financial and safety analysis.
-
MOM WSH statistics: The 1H2026 WSH Report provides current fatal and major injury rates by sector, essential for benchmarking your company’s risk exposure
-
WICA compensation limits: Updated limits from 1 November 2025 are summarised by Allen & Gledhill
-
Singapore building project cost study: Academic research across 47 Singapore building projects found total accident cost averaging 0.25% of contract sum, with direct accident cost at 0.165% and indirect at 0.086%
-
International comparison: The OSHA Safety Pays tool provides US-based multipliers; note that these require calibration for Singapore wage levels, insurance structures, and tender systems
-
MOSAIC tools: Contact MOSAIC Ecoconstruction Solutions for a downloadable Excel-based MOM incident cost calculator template and sample dashboards illustrating how to present incident cost data to Boards and Audit & Risk Committees
Frequently Asked Questions
These concise, CFO-friendly answers can be adapted for internal presentations and Board briefings.
How does a MOM incident cost calculator differ from a generic accident cost tool?
A MOM incident cost calculator is calibrated specifically to Singapore’s WICA compensation limits, MOM enforcement patterns, typical local insurance structures, and Singapore wage levels. It explicitly includes the financial impact of MOM stop work orders, bizSAFE implications, SDQ Framework disqualification risks, and local tender requirements-factors that generic international tools like OSHA Safety Pays do not cover. The MOM provides tools to help organizations estimate comprehensive costs from workplace incidents within the Singapore regulatory context.
What types of costs are most often missed by Singapore companies?
The most commonly missed injury costs include schedule penalties under SIA or PSSCOC construction contracts, management time and opportunity cost during major incident investigations, and insurance premium escalations over 3–5 years. Hidden costs vary and might include downtime and lost production as a result of workplace accidents, as well as reduced employee morale leading to higher turnover. Administrative burdens can result from time spent on incident investigations, potentially disrupting business operations far beyond the immediate accident site.
Can small SMEs really justify building such a calculator?
Absolutely. Even a 30-person fabrication workshop facing an S$80,000 incident can be severely impacted when indirect costs-overtime, replacement wages, administrative time, insurance increases-are factored in. A simple calculator requires only basic spreadsheet skills. SMEs should start with a stripped-down version focusing on their top five cost categories: WICA/medical, lost time, overtime, replacement hiring, and insurance premium change. The revenue impact at typical SME profit margins makes even simple calculations revealing.
How often should we update our incident cost assumptions and multipliers?
Review annually at minimum, or immediately after major incidents or clusters of incidents, significant changes in WICA/MOM penalties or insurance terms, or shifts into new project types or risk profiles (e.g., tunnelling, marine works). BizSAFE certification renewal every three years is a natural checkpoint for refreshing your risk management approach and recalibrating cost assumptions.
How can MOSAIC Ecoconstruction Solutions support our financial analysis of workplace accidents?
MOSAIC can conduct a one-time or recurring review of your historical accident data to calibrate multipliers with real company-specific figures. We integrate the incident cost calculator into broader bizSAFE, ISO 45001, and risk management frameworks. We also train internal safety and finance teams to use the tool independently for budgeting, Board reporting, and insurance negotiations-ensuring your company can calculate and communicate the true cost of every workplace incident.