
Safety performance indicators give safety leaders measurable, actionable signals that link preventive activity to incident outcomes — converting raw safety activity into the kind of evidence that drives resource decisions, regulatory compliance, and demonstrable program value. A Safety Performance Indicator (SPI) is a quantifiable measure used to monitor, evaluate, and improve the effectiveness of a safety and health program over time. Three authoritative bodies shape how U.S. practitioners develop and apply these metrics: the Occupational Safety and Health Administration (OSHA), the National Institute for Occupational Safety and Health (NIOSH), and the American Society of Safety Professionals (ASSP). Their combined guidance establishes the foundational framework that every serious SPI program should reference.
Table of Contents
- What is the role of safety performance indicators in prevention?
- How do you develop effective SPIs step by step?
- What concrete metrics should you track and how are they calculated?
- How do you set baselines, SMART targets, and benchmarks?
- How do SPIs drive improvement through PDCA and executive reporting?
- What governance structures keep SPI data reliable?
- What are the most damaging SPI measurement mistakes?
- A construction SPI program in practice: steps and outcomes
- What should you do in the next 7–30 days to launch your SPI program?
- Key Takeaways
- Why a balanced SPI program is worth the investment
- MOSAIC’s SPI implementation support for construction firms
- Useful sources for further reading
What is the role of safety performance indicators in prevention?
SPIs serve two distinct but interdependent functions: they reveal whether preventive activities are working before an incident occurs, and they document outcomes after the fact. OSHA distinguishes these two functions through the leading/lagging framework, which is the most consequential structural decision a safety manager makes when designing a measurement program.
Leading indicators are proactive, effort-based measures that capture safety-related behaviors and conditions before harm occurs. They answer the question: “Are we doing the right things?” Examples include near-miss reporting rates, safety observation completion percentages, training completion rates, and the time elapsed between a hazard report and management’s corrective response.
Lagging indicators measure outcomes that have already occurred: injuries, illnesses, fatalities, and their associated rates. The Total Recordable Incident Rate (TRIR), Days Away, Restricted, or Transferred (DART) rate, and Lost Time Injury Frequency Rate (LTIFR) are the most widely tracked. They confirm whether the program produced results, but they cannot prevent the incident that generated the data.
OSHA’s guidance is explicit: a mature safety program uses leading indicators to drive change and lagging indicators to measure effectiveness. Early-stage programs often rely heavily on lagging metrics because the data already exists. As programs mature, leading indicators should become the primary focus, with lagging metrics serving as validation rather than the primary signal. One critical caution: a drop in injury rates does not automatically mean the program is working. It may instead reflect underreporting driven by fear of consequences — a cultural failure that leading indicators can expose where lagging metrics cannot.
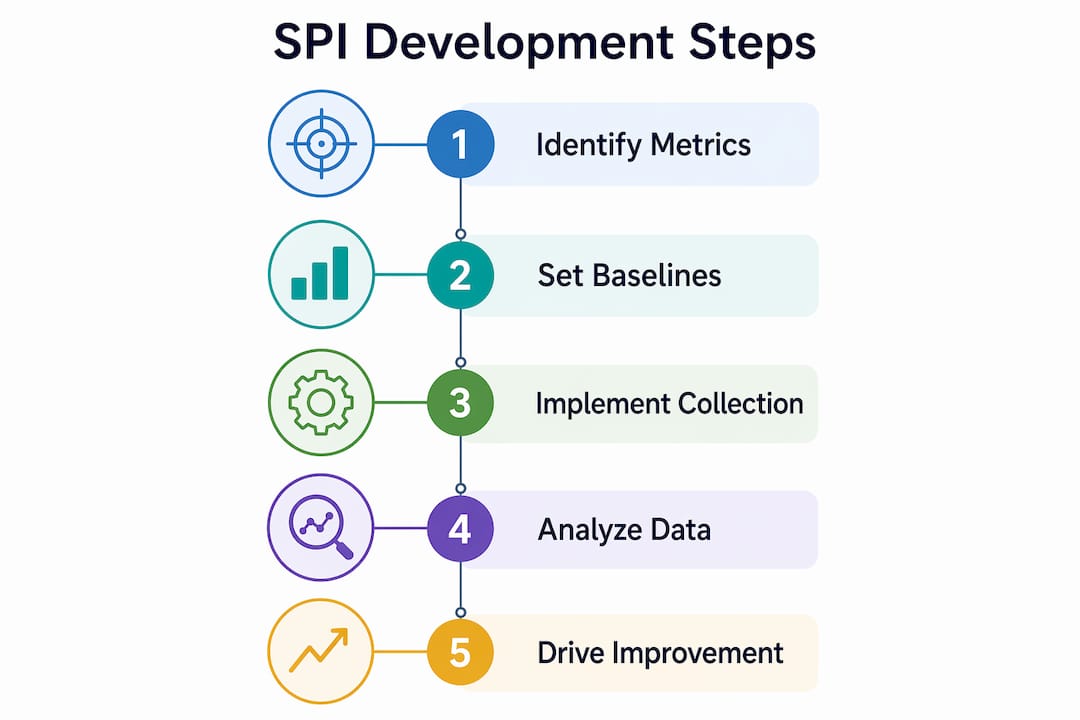
How do you develop effective SPIs step by step?
A repeatable development process prevents the most common failure mode: selecting metrics that are easy to collect but disconnected from the hazards that actually drive risk.
-
Define program objectives. Identify what the safety program must achieve: regulatory compliance, reduction of a specific injury type, cultural improvement, or certification readiness. Objectives anchor every subsequent metric choice.
-
Identify priority hazards and workflows. Review incident history, job hazard analyses, and near-miss logs to determine which tasks and exposures carry the highest consequence. Construction sites, for example, should prioritize fall protection, struck-by, and electrical hazards given their disproportionate fatality contribution.
-
Map required behaviors and controls. For each priority hazard, define the specific behaviors and engineering controls that must be in place. These become the basis for leading indicators.
-
Select candidate SPIs. OSHA recommends three approaches: use data already being collected, create indicators tied to a specific hazard, or develop indicators that strengthen a particular program element. Apply all three to generate a candidate list.
-
Confirm measurability. Each candidate SPI must have a clear numerator, denominator, collection method, and responsible owner before it advances. Metrics that cannot be consistently measured should be redesigned or dropped.
-
Establish a baseline and set SMART targets. A SMART target is Specific, Measurable, Achievable, Relevant, and Time-bound. Example: “Increase near-miss reporting rate from 0.8 to 2.0 per 100 workers per month within 12 months by implementing a non-punitive digital reporting system.” Baselines require at least 12 months of historical data; 24 months is preferable for seasonal industries.
-
Assign owners and collection methods. Every SPI needs a named metric owner accountable for data quality and a data steward responsible for collection and entry. Without named ownership, metrics become stale within one reporting cycle.
-
Build in a review cadence. Specify daily, weekly, monthly, and quarterly review frequencies for each metric based on its sensitivity and the speed at which corrective action is possible.
Pro Tip: Resist the temptation to adopt a generic leading indicator list from a published template. Customize each leading indicator to the highest-risk workflows on your specific sites. A scaffolding contractor’s most predictive leading indicator is not the same as a mechanical contractor’s — and using the wrong list produces data that looks active but predicts nothing.
What concrete metrics should you track and how are they calculated?
The table below covers the core SPIs used in U.S. construction and general industry, with formulas and collection notes.

| Metric | Type | Formula / Calculation | Collection Method | Construction Priority |
|---|---|---|---|---|
| TRIR (Total Recordable Incident Rate) | Lagging | (Recordable incidents × 200,000) ÷ total hours worked | OSHA log | High |
| DART Rate | Lagging | (DART cases × 200,000) ÷ total hours worked | OSHA log | High |
| LTIFR (Lost Time Injury Frequency Rate) | Lagging | — | OSHA log | High |
| Near-Miss Reporting Rate | Leading | Near misses reported ÷ total workers × 100 | Digital reporting app or paper form | Very High |
| Safety Observation Completion | Leading | Observations completed ÷ observations scheduled × 100 | Field inspection software | High |
| Training Completion Rate | Leading | Workers trained ÷ workers required to train × 100 | LMS or attendance records | High |
| Corrective Action Close-Out Rate | Leading | Actions closed on time ÷ total open actions × 100 | CAPA tracking system | High |
| Permit Compliance Rate | Leading | Compliant permits ÷ total permits issued × 100 | Permit log | Very High |
| Audit Finding Close-Out Rate | Leading | Findings closed ÷ total findings × 100 | Audit management system | Medium |
For construction specifically, near-miss reporting rate and permit compliance rate carry outsized diagnostic value. Near-miss reporting signals the health of the reporting culture itself: low rates in a hazardous environment indicate that workers either do not recognize hazards or do not trust the reporting system, both of which are precursors to serious incidents.
On dashboard composition, industry guidance suggests a practical target of 8–12 KPIs total, with a roughly 3:1 ratio of leading to lagging indicators. This balance provides predictive coverage without creating measurement overload that causes frontline teams to disengage from the process. Tracking 25 metrics with poor data quality is far less useful than tracking 10 with rigorous definitions and consistent collection.
Safety induction completion is a leading indicator that construction programs frequently undervalue. When induction rates fall below 100%, the gap represents workers operating on site without baseline hazard awareness — a direct precursor exposure that TRIR cannot capture until after the fact.
How do you set baselines, SMART targets, and benchmarks?
Turning raw metric data into a management tool requires three elements: a credible baseline, a realistic target, and an appropriate benchmark for context. Without these elements, metric data remains descriptive rather than actionable.
Establishing a baseline:
- Use a minimum 12-month look-back period; 24 months is preferable to smooth seasonal variation.
- Audit data quality before accepting historical figures: check for gaps, definitional inconsistencies, and periods of underreporting.
- Document the baseline period, data sources, and any known anomalies so future reviewers understand the starting point.
- For new metrics with no history, run a 60–90 day pilot collection period before setting a formal baseline.
Setting SMART targets:
- TRIR: “Reduce TRIR from 3.2 to 2.5 by December 31, 2026, through enhanced fall protection inspections and supervisor accountability reviews.”
- Near-miss reporting: “Increase near-miss reports from 1.2 to 3.0 per 100 workers per month within 12 months by deploying a mobile reporting tool and removing punitive consequences.”
- Corrective action close-out: “Achieve 90% on-time close-out of audit findings within 30 days by Q3 2026 by assigning a named owner to every finding at the time of issuance.”
Benchmarking considerations:
- Internal historical benchmarks are the most defensible starting point because definitions and collection methods are consistent.
- External benchmarks from OSHA’s Bureau of Labor Statistics (BLS) industry data, ASSP surveys, or sector-specific databases provide context but require careful interpretation. A TRIR of 2.8 may be below the BLS average for general construction but above the top-quartile performance for a specialty contractor.
- Definitional mismatches are the primary hazard in external benchmarking: one organization’s “recordable” may differ from another’s based on first-aid thresholds, return-to-work programs, or case classification practices. Never treat an external benchmark as a direct apples-to-apples comparison without verifying the underlying definitions.
How do SPIs drive improvement through PDCA and executive reporting?
Collecting metrics without closing the improvement loop is the most prevalent failure in safety measurement programs. NIOSH and ASSP emphasize that the real value of safety metrics lies in demonstrating that improvements in leading indicators predictably lead to better lagging outcomes — a relationship that must be actively validated, not assumed.

The Plan-Do-Check-Act (PDCA) cycle provides the operational structure for this validation:
| PDCA Phase | SPI Application | Frequency |
|---|---|---|
| Plan | Set targets, assign owners, define collection protocols | Annually / program launch |
| Do | Collect SPIs, run inspections, deliver training, close corrective actions | Daily / weekly |
| Check | Review dashboards, compare actuals to targets, identify gaps | Weekly / monthly |
| Act | Adjust controls, reallocate resources, escalate persistent gaps | Monthly / quarterly |
Reporting cadence by audience:
Frontline supervisors need daily or weekly leading indicator data: observation counts, permit compliance, and open corrective actions. Operations managers need weekly trend summaries that flag deteriorating metrics before they become incidents. Executives need monthly or quarterly dashboards that translate safety performance into financial terms: workers’ compensation cost avoidance, productivity impact, and regulatory fine exposure.
Using leading indicators to make the executive case requires connecting effort metrics to cost outcomes. When near-miss reporting rates increase and corrective actions close on time, the downstream effect is fewer recordable incidents, lower workers’ compensation premiums, and reduced production delays. Quantifying that chain — even conservatively — converts safety from a compliance cost into a demonstrable return. For construction firms, the long-term cost savings from proactive hazard control are well documented and provide credible talking points for capital allocation discussions.
Validating predictive value requires patience. Consistent data over 2–3 years is typically necessary before a meaningful correlation between leading indicator trends and lagging outcomes can be demonstrated. Short-term correlations are frequently artifacts of seasonal variation or reporting culture shifts rather than genuine program effects. Set this expectation with leadership at program launch to prevent premature conclusions.
What governance structures keep SPI data reliable?
Data quality failures are the silent killer of SPI programs. A dashboard populated with inconsistently defined, poorly collected metrics produces false confidence — or, worse, actively misleads resource decisions.
A minimum governance framework requires five elements: a precise written definition for each metric (numerator, denominator, inclusion/exclusion criteria), a specified collection frequency, a named metric owner, a validation rule (who checks the data before it enters the dashboard), and a defined retention period. Without all five, metrics drift in definition over time and become incomparable across reporting periods.
Recommended roles:
- Metric Owner: Accountable for the metric’s accuracy and trend interpretation; typically a safety manager or department head.
- Data Steward: Responsible for collection, entry, and first-level validation; typically a safety coordinator or field supervisor.
- Analyst: Aggregates data, produces dashboard outputs, and flags anomalies for review.
- Accountable Manager: Reviews dashboard outputs and authorizes resource responses to adverse trends.
OSHA’s guidance on role assignment reinforces that clear ownership and validation rules directly reduce the risk of metrics becoming stale or ignored. For collection systems, the choice between paper forms, mobile inspection apps, spreadsheets, or integrated EHS platforms depends on workforce literacy, site connectivity, and budget. Safety meeting software designed for construction environments can consolidate observation records, meeting attendance, and corrective action tracking in a single system, reducing transcription errors and improving data timeliness. Whatever system is chosen, the definitions must be locked before collection begins — changing a metric’s definition mid-stream invalidates historical comparisons.
Qualitative checks should complement quantitative counts. Tracking the number of incident investigations completed is useful; auditing whether those investigations produced accurate root-cause analyses and appropriate corrective actions is more useful. Volume metrics without quality checks create the illusion of rigor.
What are the most damaging SPI measurement mistakes?
-
Overreliance on lagging metrics. Treating TRIR as the primary or sole performance signal means the program only learns from incidents that have already occurred. A TRIR of zero in a high-hazard environment is not proof of safety; it may be proof of underreporting.
-
Tracking too many indicators. Programs that monitor 20 or more metrics typically see data quality degrade across all of them. The 8–12 KPI target with a 3:1 leading-to-lagging ratio exists precisely to prevent this. More metrics require more collection effort; when that effort exceeds capacity, shortcuts emerge.
-
Misaligned incentives. Tying bonuses or performance reviews to incident rates creates powerful pressure to suppress reporting. The result is a lagging metric that looks favorable while the underlying hazard environment deteriorates. Non-punitive reporting systems and explicit separation of safety metrics from individual performance bonuses are the structural fixes.
-
Poor metric definitions. When “near miss” means different things to different supervisors, the aggregate count is meaningless. Definitions must be written, trained, and tested before data collection begins.
-
Failing to close the PDCA loop. Collecting data without making resource decisions or corrective actions based on it is the most common failure. Metrics must feed decisions; otherwise, the collection effort is administrative overhead with no safety value.
-
Selecting generic indicators not linked to site-specific hazards. A leading indicator that does not correspond to a prioritized hazard in the site’s risk register produces data that is active but not predictive.
A construction SPI program in practice: steps and outcomes
A mid-size commercial construction contractor operating across three active sites faced a persistent TRIR above the industry average, with falls and struck-by incidents accounting for the majority of recordable cases. The safety team, working with QES consultancy support, structured an SPI program around five leading indicators: fall protection inspection compliance, near-miss reporting rate, toolbox talk completion, corrective action close-out rate, and permit-to-work compliance.
In the first 30 days, the team established baselines for each metric using 12 months of existing records, identified data gaps in the near-miss log (which had fewer than five entries for the prior year — a clear underreporting signal), and assigned a named metric owner and data steward for each indicator. A simple mobile reporting tool replaced the paper near-miss form, and supervisors received explicit assurance that reports would not trigger disciplinary action.
By month three, near-miss reports had increased substantially, revealing recurring fall-exposure conditions at stairwell openings that had not appeared in the incident log. Corrective actions were issued, tracked, and closed within the defined 30-day window. Fall protection inspection compliance, initially at 71%, reached 94% by month four through weekly supervisor accountability reviews tied to the dashboard.
At the six-month mark, the DART rate had declined relative to the prior-year period, and the team documented the leading-to-lagging correlation for the executive briefing. The primary lesson: the near-miss reporting system was the highest-leverage single change, because it surfaced hazards that the incident log had systematically concealed. Proactive risk management at the workflow level, informed by real-time leading indicator data, produced faster corrective cycles than the prior reactive model.
What should you do in the next 7–30 days to launch your SPI program?
-
Days 1–3: Convene a one-hour scoping session with your safety team. List the five highest-priority hazards from your current risk register and identify which behaviors and controls must be in place to manage each.
-
Days 3–5: Select 3–6 candidate SPIs (at least two leading, one lagging) directly tied to the priority hazards identified. Apply the measurability test: confirm numerator, denominator, and collection source for each.
-
Days 5–7: Assign a metric owner and data steward to each SPI. Document the metric definition in writing. Run a one-week trial collection to surface definition ambiguities and collection gaps before committing to the full program.
-
Days 7–14: Pull 12 months of historical data for each metric and establish a formal baseline. Note any data quality issues that require remediation before the baseline is accepted.
-
Days 14–21: Set one SMART target per SPI. Present the draft SPI set and targets to operations leadership for alignment. Confirm that the metrics connect to business objectives leadership already cares about.
-
Days 21–30: Build a prototype dashboard (even a simple spreadsheet is sufficient at this stage). Schedule the first PDCA review meeting. Prepare a one-page executive briefing that translates the leading indicator targets into projected cost avoidance over 12 months.
Key Takeaways
A balanced SPI program combining leading and lagging indicators, governed by clear ownership and PDCA discipline, is the most reliable mechanism for converting safety activity into measurable, defensible performance improvement.
| Point | Details |
|---|---|
| Lead with leading indicators | Target a 3:1 ratio of leading to lagging metrics across an 8–12 KPI dashboard to maximize predictive coverage. |
| Baseline before targeting | Establish at least 12 months of historical data per metric before setting SMART improvement targets. |
| Validate over 2–3 years | Correlating leading indicator trends to lagging outcomes requires consistent data across 2–3 years to produce reliable conclusions. |
| Governance prevents drift | Every SPI needs a written definition, named owner, validation rule, and review cadence or data quality degrades within one reporting cycle. |
| Com’s consultancy approach | MOSAIC Ecoconstruction Solutions provides SPI program design, audit, KPI selection, and dashboard implementation tailored to construction sector risk profiles. |
Why a balanced SPI program is worth the investment
The most persistent misconception in safety measurement is that a low incident rate is sufficient evidence of program effectiveness. It is not. A TRIR of zero in a high-hazard construction environment is as likely to reflect a suppressed reporting culture as it is to reflect genuine hazard control. The organizations that discover this the hard way do so after a serious incident that their lagging metrics gave no warning of.
What actually distinguishes high-performing safety programs is not the absence of incidents in the record — it is the presence of a functioning early-warning system. Leading indicators, when properly defined and consistently collected, provide that system. They reveal whether the controls that prevent the most consequential incidents are actually in place and functioning, not just documented in a procedure manual.
The PDCA discipline matters equally. Many organizations collect SPIs diligently and then fail to make any resource decision based on the data. Metrics that do not feed decisions are administrative overhead. The measurement loop is only closed when a trend in the dashboard triggers a specific, assigned, time-bound corrective action — and when that action’s effectiveness is subsequently verified through the same metrics.
For construction safety managers operating under OSHA’s regulatory framework, the practical payoff of a well-governed SPI program extends beyond compliance. It produces the documented evidence base that supports workers’ compensation negotiations, insurance renewals, and client prequalification requirements — all of which increasingly demand quantitative safety performance data rather than a clean incident log.
MOSAIC’s SPI implementation support for construction firms
Construction safety managers who need to move from concept to a functioning SPI dashboard quickly will find that the design and governance decisions are where most programs stall. MOSAIC Ecoconstruction Solutions provides structured QES consultancy that covers the full implementation sequence: hazard-specific KPI design, baseline establishment, dashboard architecture, and PDCA coaching through the first full review cycle.

The service scope includes safety audits that generate the baseline data needed to populate an initial SPI set, corrective action tracking frameworks, and executive briefing support that connects leading indicator performance to cost avoidance and regulatory compliance outcomes. For firms evaluating their current consultancy arrangements, MOSAIC’s consultancy service overview outlines the specific deliverables and engagement model. Teams that want to see what a completed audit output looks like before committing can review safety audit examples that illustrate the depth and format of MOSAIC’s analytical work. Contact MOSAIC to schedule a discovery call and receive a one-page SPI starter template calibrated to your site’s priority hazards.
Useful sources for further reading
-
OSHA Leading Indicators: The primary U.S. regulatory reference for leading indicator definitions, rationale, and program integration guidance. Start here for policy grounding.
-
OSHA Leading Indicators PDF: Practical examples of leading indicators organized by program element (worker participation, management leadership, hazard identification, training). Useful for populating a candidate SPI list.
-
NIOSH Evaluating Safety Practice: NIOSH guidance on validating that safety investments produce measurable outcomes; directly supports the leading-to-lagging correlation methodology.
-
SMART QHSE: How to Measure Safety Performance: Practical how-to guide covering SMART targets, dashboard composition, and the 3:1 leading-to-lagging ratio recommendation.
-
SafetyCulture: Safety Metrics: Accessible reference for metric definitions and near-miss reporting best practices; useful for training safety coordinators on metric concepts.
-
MEM: Safety Metrics: Practical framing of effort vs. outcome KPIs and why no single metric is sufficient; useful for executive briefing preparation.
-
Construction safety statistics: Industry-level data for benchmarking context and understanding sector-specific incident trends in U.S. construction.
-
MOSAIC Ecoconstruction Solutions: QES consultancy resource for construction firms seeking structured SPI program design, audit support, and implementation coaching.