

Safety benchmarking gives organizations an objective, comparable picture of their safety performance so they can prioritize the highest-impact improvements, meet regulatory expectations, and demonstrate measurable progress to clients, insurers, and the Board. For construction leaders in Singapore, the case is particularly direct: frameworks like BizSAFE and ISO 45001 explicitly require performance evaluation and continual improvement, and the Ministry of Manpower (MOM) and WSH Council treat documented benchmarking as evidence of a functioning safety management system.
Three benefits stand out before any deeper analysis:
- Risk reduction and gap identification: Comparing your incident rates, near-miss frequencies, and process indicators against sector peers reveals where your controls are weakest, before a fatality or enforcement action forces the issue.
- Procurement and tendering advantage: Singapore’s public-sector and major private-sector tenders increasingly score safety performance; a benchmarked, documented safety record is a differentiator that generic compliance certificates cannot replicate.
- Insurance and financial positioning: Sector-wide benchmarking evidence shows that top-performing organizations secure better insurance terms and lower premiums by demonstrating sustained, peer-verified safety performance.
Key Takeaways
Safety benchmarking is the most direct path to objective, peer-verified evidence of safety performance improvement, and in Singapore’s construction sector it is increasingly a prerequisite for competitive tendering, BizSAFE renewal, and favorable insurance positioning.
| Point | Details |
|---|---|
| Start with leading indicators | Near-miss reporting rate and toolbox meeting completion respond faster to intervention than lagging outcome data. |
| Normalize before comparing | Agree on exposure-hour basis, incident definitions, and a minimum 12-month data window before any cross-organization comparison. |
| Use all three evaluation layers | Combine compliance audits, performance benchmarking, and culture assessment to surface systemic failures that no single method reveals. |
| Align outputs to BizSAFE and ISO 45001 | Peer-comparison reports, gap analyses, and Board-approved action plans satisfy Clause 9 performance evaluation requirements directly. |
| MOSAIC accelerates the process | MOSAIC Eco-construction Solutions scopes and facilitates benchmarking pilots aligned to Singapore’s regulatory and tendering requirements. |
Table of Contents
- What safety benchmarking actually means, and the types you can run
- The concrete benefits that justify the investment
- What to benchmark: leading indicators, lagging indicators, and qualitative measures
- How OHS leaders use benchmarking outputs for decisions
- A step-by-step benchmarking process for Singapore organizations
- Common pitfalls and how to avoid them
- How benchmarking supports BizSAFE, ISO 45001, and Singapore tendering
- Research-backed best practices: why a multi-layered approach matters
- A Singapore consultancy perspective on where benchmarking delivers fastest
- How MOSAIC Eco-construction Solutions supports your benchmarking program
- Sources
What safety benchmarking actually means, and the types you can run
Safety benchmarking is the planned, methodical comparison of your organization’s safety processes and performance data against those of peers, best-practice organizations, or your own historical baselines, with the explicit purpose of learning how to reduce accidents, improve compliance, and cut associated costs. The emphasis is on learning, not ranking.
Five types are commonly used in practice:
Performance benchmarking compares outcome data: injury frequency rates, lost-time incident rates, and similar lagging indicators. It answers “how do our results compare?” A Singapore contractor preparing a BizSAFE Star renewal, for example, would use performance benchmarking to show MOM that its incident rate sits below the sector median.
Process (or practice) benchmarking examines how work is done: permit-to-work systems, toolbox meeting quality, near-miss reporting rates. This type often uncovers higher-value changes than outcome benchmarking alone, because it surfaces the systemic causes behind poor results rather than just the results themselves.
Internal benchmarking compares divisions, project sites, or business units within the same organization. It is the lowest-friction starting point because data definitions are already shared and confidentiality is not a barrier.
External (sector) benchmarking compares your organization against industry peers or national averages published by the WSH Council or MOM. It provides the external reality check that prevents internal complacency.
Strategic benchmarking examines governance structures, board-level safety commitments, and long-term safety objectives against recognized leaders. It is most relevant when an organization is redesigning its safety management system or pursuing ISO 45001 certification.
A review of construction safety research found substantial heterogeneity in how “safety performance” is defined across organizations, which means any benchmarking design must explicitly agree on what performance means for the participating group before data collection begins.
The concrete benefits that justify the investment
The business case for safety performance evaluation is not abstract. Each benefit below maps to a specific organizational outcome that leaders can measure and report.
-
Gap identification and prioritization. Benchmarking reveals where your controls underperform relative to peers, giving safety managers an evidence base to prioritize corrective action rather than relying on intuition or the most recent incident. IOSH research confirms that benchmarking provides an external reality check that helps organizations avoid complacency by comparing performance against peers and best practice.
-
Realistic target setting. Internal targets set without external reference tend to be either too conservative or unachievable. Peer data anchors targets to what comparable organizations have actually achieved, making improvement plans credible to Boards and auditors alike.
-
Safety culture and engagement. When workers and supervisors see their site’s performance mapped against sector peers, safety becomes a measurable team objective rather than a compliance obligation. Linking benchmarking results to contractor safety culture programs accelerates this shift.
-
Procurement, tendering, and insurance. Strong benchmarking results, presented as peer-verified comparative data, support tender bids and insurance negotiations in ways that a single audit certificate cannot. Documented evidence of sustained above-median performance is increasingly expected in Singapore’s public-sector procurement scoring.
-
Continual improvement under ISO 45001 and BizSAFE. Both frameworks require documented evidence of performance evaluation and improvement cycles. Benchmarking outputs, including gap analyses, target-setting records, and Board-reviewed improvement plans, satisfy those requirements directly.
-
Regulatory and reputational positioning. MOM and the WSH Council treat organizations that can demonstrate systematic, evidence-based safety management more favorably during inspections and enforcement reviews. Benchmarking is one of the clearest signals of that systematic approach.
Pro Tip: When presenting benchmarking results to a Board or insurer, frame the data as a peer-percentile position rather than a raw number. “Our lost-time incident rate places us in the top quartile of Singapore construction contractors” is far more persuasive than “our LTIR is 0.8,” because it contextualizes performance in terms decision-makers can evaluate without specialist knowledge.
What to benchmark: leading indicators, lagging indicators, and qualitative measures
Benchmark both leading and lagging indicators, and include qualitative measures such as safety culture assessments and near-miss reporting quality, because no single metric type gives a complete picture of safety program health.
| Indicator type | Examples | Strengths | Limitations |
|---|---|---|---|
| Lagging (outcome) | Lost-time injury frequency rate (LTIFR), total recordable incident rate (TRIR), fatality rate | Directly comparable; widely reported; understood by Boards and insurers | Backward-looking; low incident counts create statistical noise; can be gamed by under-reporting |
| Leading (process/activity) | Near-miss reporting rate, safety observation frequency, toolbox meeting completion rate, permit-to-work compliance | Predictive; actionable before harm occurs; harder to game if well-designed | Less standardized; requires consistent definitions across sites; harder to compare externally |
| Qualitative | Safety culture survey scores, SRM panel composition, near-miss report quality ratings, management commitment indices | Captures systemic and behavioral dimensions missed by quantitative data | Subjective; requires validated instruments; difficult to normalize across organizations |
ISO TR 45004 guidance recommends selecting a balanced set of leading and lagging indicators and explicitly warns about unintended consequences when indicators are misused or treated as targets in themselves.
Relying solely on accident data or EMR-style measures is insufficient and can be actively misleading, particularly in construction where incident under-reporting is a known risk. Mixed-method indicator sets, combining operational process indicators with quantitative outcomes, produce more replicable and defensible comparisons across organizations.
Data normalization is non-negotiable. Before any cross-organization comparison, agree on standard definitions for exposure hours, incident classification, and reporting thresholds. A checklist for valid comparisons:
- Confirm all parties use the same incident classification standard (e.g., MOM’s WSH reporting categories).
- Normalize incident counts by exposure hours, not headcount.
- Agree on a minimum data period (typically 12 months) to reduce statistical noise.
- Document any site-specific factors (high-risk work types, subcontractor mix) that may legitimately explain performance differences.
Selecting the right construction KPIs at the outset prevents the most common normalization failures.
How OHS leaders use benchmarking outputs for decisions
Benchmarking informs leadership decisions at three distinct levels: conceptual (shaping strategy and understanding), symbolic (building credibility and trust), and instrumental (directing resources and triggering specific actions).
Research from the Institute for Work & Health confirms that OHS leaders use benchmarking reports to support all three modes, including justifying resource allocation for safety equipment, training initiatives, and process changes.
Conceptual use means the benchmarking data changes how leaders understand their safety position. A site manager who discovers that their near-miss reporting rate is half the sector median will reconsider whether their reporting culture is genuinely open or whether incidents are being suppressed.
Symbolic use means the data is deployed externally to signal organizational credibility: in tender submissions, Board presentations, annual reports, and insurance renewals. A peer-percentile position is a credible, verifiable claim that generic compliance statements cannot match.
Instrumental use is the most direct: a specific finding triggers a specific action. A gap in permit-to-work compliance rates leads to a targeted retraining program; a below-median safety culture score leads to a structured engagement initiative.
A practical decision-tree for leaders reviewing a benchmarking finding:
- Is the gap statistically meaningful given sample size and exposure hours? If not, treat it as a watch item, not an action trigger.
- Is the gap in a leading indicator (process) or a lagging indicator (outcome)? Process gaps usually have faster, lower-cost remediation paths.
- Does the gap align with a known risk in your safety risk assessment workflow? If yes, escalate priority.
- Who owns the remediation: site management, procurement, HR, or the Board? Assign accountability before closing the analysis.
A step-by-step benchmarking process for Singapore organizations
A practical benchmarking process runs through five to seven structured steps: define scope, select peers, agree definitions, collect and normalize data, analyze gaps, set targets, and monitor progress. Primatech’s benchmarking guidance frames this as a learning process rather than a competitive exercise, with SMARTT action plans converting findings into organizational change.
Step 1: Define scope and objectives. Decide whether you are benchmarking a single site, a project type, or the whole organization. Clarify whether the focus is outcomes, processes, or both. A narrow, well-defined scope produces more actionable findings than a broad one.
Step 2: Select peers. For internal benchmarking, identify comparable sites or business units. For external benchmarking, select peers with similar work types, project scale, and workforce composition. Mismatched peers are the single most common source of misleading results.
Step 3: Agree definitions and data formats. Before any data is collected, document agreed definitions for every metric, the exposure-hour basis, and the incident classification standard. Use a shared data template to eliminate format inconsistencies.
Step 4: Collect and normalize data. Gather data over a consistent period (minimum 12 months). Normalize by exposure hours. Flag and document any anomalies or site-specific factors that may affect comparability.
Step 5: Analyze and identify gaps. Compare normalized data across peers. Identify statistically meaningful gaps in both leading and lagging indicators. Prioritize gaps by risk significance and remediation feasibility.
Step 6: Set targets and action plans. Set specific, time-bound improvement targets anchored to peer performance levels. Assign ownership and resources. Document in a format suitable for Board review and BizSAFE/ISO 45001 evidence files.
Step 7: Implement and monitor. Track progress against targets at defined intervals (quarterly is typical). Feed results back into the next benchmarking cycle to demonstrate continual improvement.
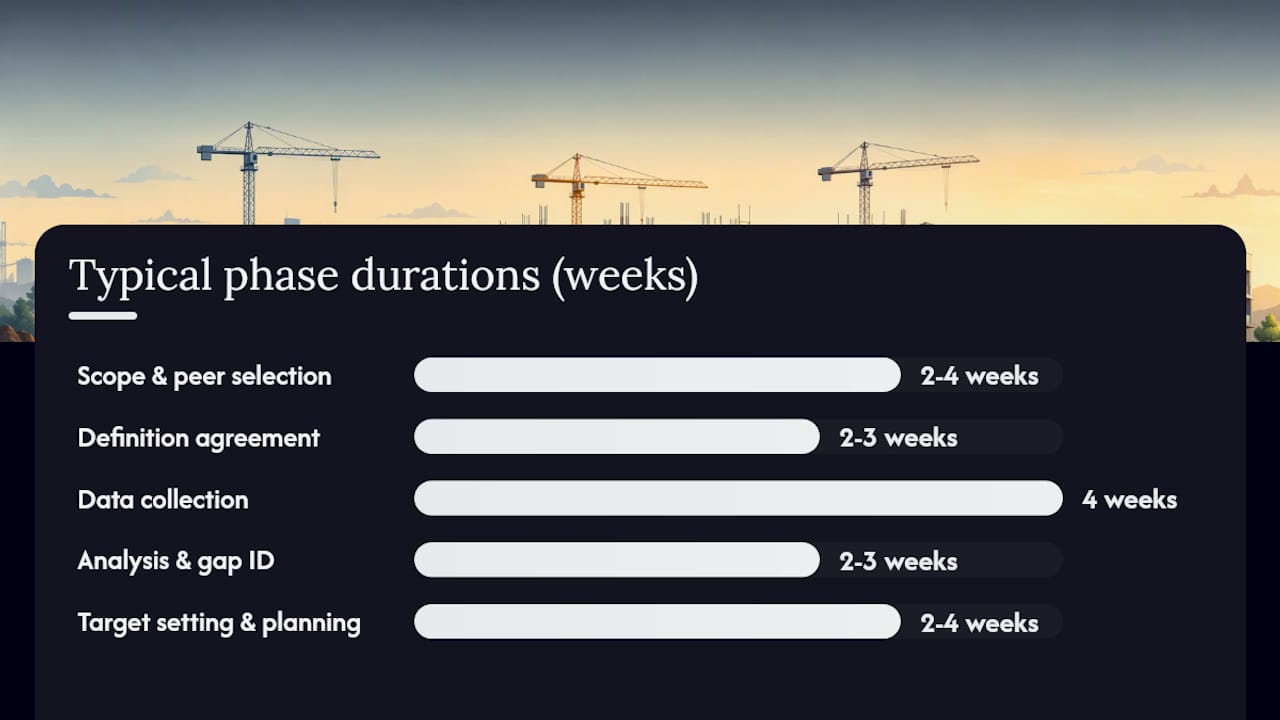
Typical timeline and effort factors:
| Phase | Typical duration | Key effort drivers |
|---|---|---|
| Scope definition and peer selection | 2–4 weeks | Stakeholder alignment, peer availability |
| Definition agreement and data template design | 2–3 weeks | Number of metrics, partner coordination |
| Data collection and normalization | 4 weeks | Data quality, cleaning effort |
| Analysis and gap identification | 2–3 weeks | Analytic complexity, number of peers |
| Target setting and action planning | 2–4 weeks | Board/senior sponsor approval cycle |
| Total (first cycle) | 3–6 months | Third-party facilitation reduces elapsed time |
Stakeholder approvals required: Board or senior sponsor (to authorize scope and resources), data owner (to validate data quality), HR and operations (to confirm workforce and exposure data), and procurement (if benchmarking results will be used in tender submissions).
Common pitfalls and how to avoid them
- Poor peer selection. Comparing a small residential contractor against a large civil engineering firm produces meaningless results. Fix: define peer selection criteria before outreach and document the rationale.
- Inconsistent definitions. If one organization counts near-misses differently from another, the comparison is invalid. Fix: use a shared data dictionary and a standard template agreed before data collection.
- Over-reliance on lagging indicators. A low injury rate can mask systemic process failures that have not yet produced a recordable incident. Fix: always include at least two leading indicators in the benchmarking set.
- Data gaming. When benchmarking results influence bonuses or procurement scores, under-reporting pressure increases. Fix: use third-party facilitation and anonymous aggregation where possible; design metrics that are harder to manipulate (e.g., near-miss reporting rate rather than zero-incident claims).
- Confidentiality and trust failures. Organizations will not share honest data if they fear competitive exposure. Fix: establish a formal confidentiality agreement before data exchange; consider a neutral third-party facilitator to hold and aggregate data.
- Scope that is too broad. Attempting to benchmark every safety metric across an entire organization in the first cycle overwhelms data owners and produces superficial findings. Fix: start with three to five high-priority metrics on a single site or project type.
The perverse incentive risk deserves specific attention: any metric that becomes a formal target can be gamed. Design your indicator set so that improving the metric genuinely requires improving the underlying safety condition, not just the reported number.
How benchmarking supports BizSAFE, ISO 45001, and Singapore tendering
Benchmarking is direct evidence of performance evaluation and continual improvement, the two requirements that both ISO 45001 and BizSAFE explicitly demand and that auditors and tender evaluators look for in documentation.
Under ISO 45001 Clause 9 (Performance Evaluation), organizations must monitor, measure, analyze, and evaluate their OH&S performance. Benchmarking outputs, including peer-comparison reports, gap analyses, and target-setting records, satisfy this clause with a level of rigor that internal-only reviews cannot match. Implementing an effective WSH management system in Singapore construction requires exactly this kind of documented, systematic evaluation.
For BizSAFE Star and Level 4 renewals, auditors expect evidence that the organization has reviewed its safety performance against external reference points and has set improvement targets accordingly. Benchmarking reports, Board minutes referencing the findings, and documented action plans constitute the strongest available evidence package.
In Singapore’s public-sector tendering, the Government Procurement framework and major statutory boards assess safety track records as part of contractor qualification. A peer-benchmarked safety record, presented as a percentile position against sector norms, is more persuasive than a standalone incident rate because it contextualizes the number for evaluators who may not be safety specialists.
For insurance conversations, MOM and WSH Council guidance supports the use of documented safety performance data in risk discussions with insurers. Organizations that can demonstrate sustained above-median performance, verified against peer data, are in a materially stronger negotiating position on premiums and coverage terms.
What to include in a tender or BizSAFE evidence pack:
- Normalized peer-comparison report (current period and trend)
- Gap analysis with prioritized findings
- Target-setting record with Board approval
- Improvement plan with assigned ownership and timelines
- Progress update against prior-cycle targets
Research-backed best practices: why a multi-layered approach matters
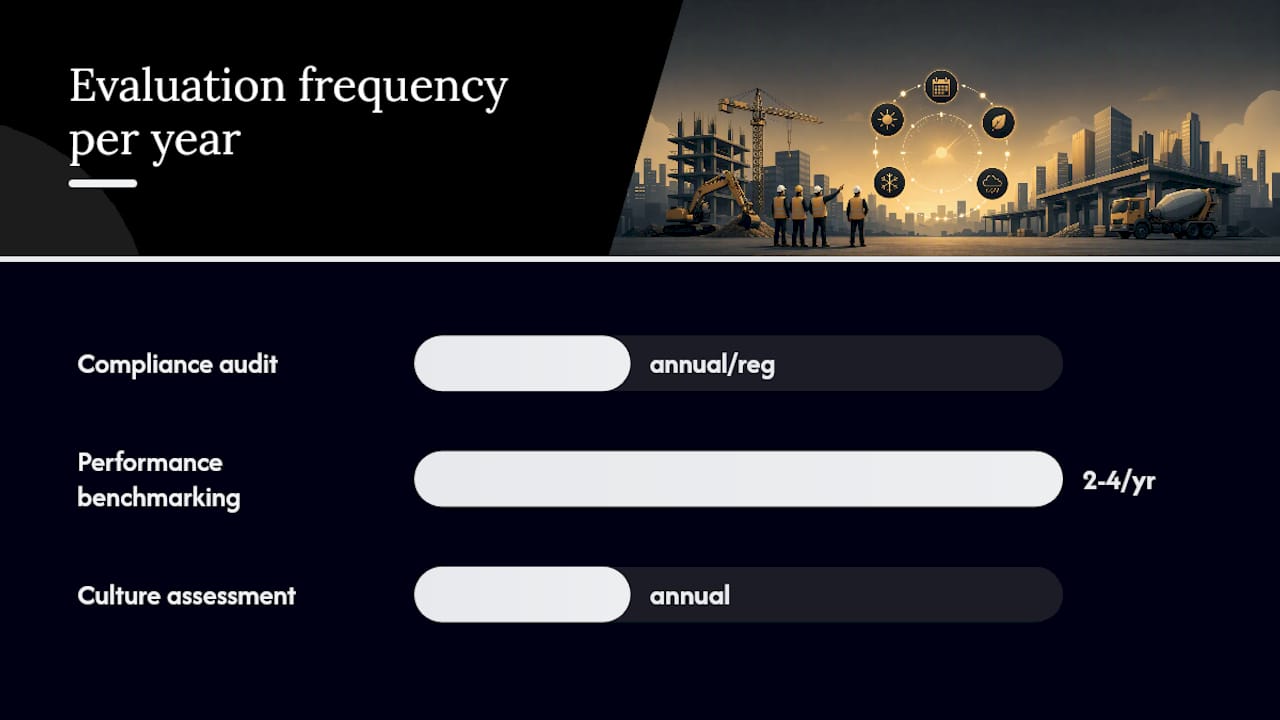
The most defensible safety performance evaluation combines traditional compliance audits with ongoing performance benchmarking and qualitative culture assessment. No single method is sufficient on its own.
MITRE’s evaluation research makes the case plainly: auditing for compliance is necessary but insufficient. Audits give a snapshot of whether procedures exist and are followed; they do not measure whether the safety management system is actually producing safer outcomes. Performance benchmarking fills that gap by tracking outcomes and process indicators over time, while culture assessment captures the behavioral and systemic dimensions that neither audits nor metrics alone reveal.
A structured three-step multi-layered evaluation:
- Compliance audit (annual or per regulatory cycle): confirms that required procedures, documentation, and controls are in place.
- Performance benchmarking (quarterly or semi-annual): tracks leading and lagging indicators against peer data to identify trends and gaps.
- Culture assessment (annual): uses validated survey instruments to measure safety climate, reporting culture, and management commitment.
In practice, organizations that combine all three methods have identified systemic failures that neither audits nor incident data alone would have surfaced. A site with a clean audit record and a low LTIFR may still have a suppressed near-miss reporting culture, a finding that only emerges from culture assessment and near-miss rate benchmarking together. Addressing that suppression before it produces a recordable incident is precisely the value of the multi-layered approach. For a deeper look at how safety management reviews fit into this framework, the evaluation structure translates directly into the SMS review cycle.
Academic reviews of safety performance evaluation methods note that highly complex quantitative approaches (AHP, DEA, structural equation models) can limit practical adoption. Choose methods proportionate to your data quality and organizational capacity; a well-executed simple benchmarking process consistently outperforms a poorly executed sophisticated one.
A Singapore consultancy perspective on where benchmarking delivers fastest
The fastest value from safety benchmarking in Singapore construction comes not from the most sophisticated analysis but from the most honest peer comparison, applied to the two or three metrics where your organization’s controls are genuinely weakest.
From MOSAIC’s experience working with contractors across Singapore’s construction sector, the most common mistakes are:
- Starting with too many metrics and producing a report that no one acts on.
- Selecting peers that make the organization look good rather than peers that reveal genuine gaps.
- Treating benchmarking as a one-time exercise rather than a quarterly management discipline.
The quick wins tend to cluster around near-miss reporting rates and toolbox meeting quality, both leading indicators that respond quickly to targeted interventions and that produce visible improvement within a single project cycle. Governance recommendations: assign a named Board sponsor for the benchmarking program, schedule a quarterly review of findings against targets, and link benchmarking outputs explicitly to the annual BizSAFE renewal and ISO 45001 management review cycle.
A low-cost pilot benchmarking exercise can be scoped to a single project site, three to five metrics, and a 12-month data window. Third-party facilitation, even for a pilot, materially improves data comparability and partner trust, because an external facilitator can standardize definitions and run normalization routines that internal teams find difficult to sustain consistently.
How MOSAIC Eco-construction Solutions supports your benchmarking program
For Singapore construction organizations ready to move from intent to execution, MOSAIC Eco-construction Solutions delivers structured benchmarking engagements that produce audit-ready evidence for BizSAFE renewals, ISO 45001 performance evaluation cycles, and tender submissions.

MOSAIC’s benchmarking service covers scope definition and peer selection, metric design and data normalization, gap analysis and target-setting documentation, and Board-ready reporting. Every engagement is aligned to MOM/WSH Council expectations and structured to generate the specific evidence that tender evaluators and BizSAFE auditors require. For organizations that need concurrent audit support, MOSAIC’s safety audit services integrate directly with the benchmarking cycle, eliminating the duplication that occurs when audits and performance evaluation run as separate workstreams.
Contact MOSAIC’s team through the safety consultancy page to scope a pilot benchmarking engagement for your next project or BizSAFE renewal cycle.
Sources
The sources below represent the most authoritative guidance available for safety benchmarking practice, indicator design, and Singapore regulatory alignment. For tender and BizSAFE evidence purposes, prioritize ISO 45001, ISO TR 45004, and the WSH Council’s published guidance. For research depth and practitioner methodology, the MITRE evaluation paper and the IWH plain-language summary are the most directly applicable.
- Is benchmarking starting to prove its worth in OSH? — IOSH Magazine
- Evaluating safety management effectiveness — MITRE
- Benefits of benchmarking health and safety performance — Safe365 Global