

Regulatory risk mapping is the systematic process of identifying, linking, and analyzing an organization’s regulatory obligations against its business processes, activities, and risk exposures to determine where non-compliance may occur. The immediate next step for any practitioner: scope a pilot around a single product line, operational process, or geographic jurisdiction, then build an obligations inventory before touching any scoring matrix.
The discipline is more precise than the phrase “compliance program” suggests. Regulatory risk mapping creates an explicit chain: obligation → process → control → evidence → owner. That chain is what makes a map auditable rather than decorative.
- Obligation: the specific legal or regulatory requirement (e.g., OSHA 29 CFR 1926.502 fall protection)
- Process: the operational activity where that obligation applies (e.g., elevated work on a construction site)
- Control: the mechanism designed to meet the obligation (e.g., guardrail installation, harness inspection protocol)
- Evidence: the record proving the control operated (e.g., signed daily inspection log)
- Owner: the named individual accountable for control performance and remediation
Pro Tip: Before scheduling a single workshop, pull your existing permits, licenses, and regulatory correspondence into one folder. That document set is your obligations seed list — it takes two hours and immediately reveals gaps in your current tracking.
Table of Contents
- What does regulatory risk mapping actually mean in practice?
- Why organizations run regulatory risk mapping and what it produces
- How to build a regulatory risk map from scoping to monitoring
- Which standards and frameworks should your map align with?
- When do you need RegTech tools versus a spreadsheet?
- What outputs does a completed map produce?
- How to govern the map and keep it current
- What does implementation actually cost and how long does it take?
- Common pitfalls and how to avoid them
- How regulatory risk mapping applies in construction — and what MOSAIC brings
- Key Takeaways
- The gap between a risk map and a compliance program
- MOSAIC’s regulatory compliance services for construction teams
- Useful sources and further reading
What does regulatory risk mapping actually mean in practice?
The formal industry term for this discipline is regulatory compliance mapping, though practitioners also use compliance risk mapping and regulatory risk assessment interchangeably. Each phrase describes the same structured methodology; the distinction worth preserving is between the two underlying risk types.
Compliance risk is the exposure arising from failing to follow rules that already exist: a missed permit renewal, an untested control, a training record that cannot be produced during an inspection. Regulatory risk, by contrast, is the exposure arising from changes in laws, enforcement priorities, or regulatory interpretation that alter what compliance requires. A construction firm that maps only its current obligations without monitoring OSHA rulemaking activity is managing compliance risk but ignoring regulatory risk entirely.
A concrete example clarifies the distinction. Suppose a general contractor is subject to EPA’s Construction General Permit (CGP) for stormwater discharges. The mapping exercise would:
- Record the CGP as an obligation in the regulatory register
- Link it to the site preparation and grading processes where stormwater exposure occurs
- Identify the Stormwater Pollution Prevention Plan (SWPPP) as the primary control
- Specify the evidence required (weekly inspection reports, corrective action logs)
- Assign the site superintendent as control owner
When EPA proposes revisions to the CGP, that is a regulatory risk event requiring the map to be updated before the rule takes effect.
| Concept | Definition | Primary Question |
|---|---|---|
| Regulatory risk mapping | Linking obligations to processes, controls, and owners | Where could non-compliance occur? |
| Compliance risk | Exposure from failing existing rules | Are current controls working? |
| Regulatory risk | Exposure from changes in law or enforcement | What new obligations are coming? |
| Risk register | Scored inventory of identified risks | What is the priority order for remediation? |
| Controls matrix | Catalog of controls mapped to obligations | Which controls cover which requirements? |
Pro Tip: Use construction compliance terminology as a shared reference when onboarding legal, operations, and project management teams; definitional alignment at the start prevents scope disputes later.

Why organizations run regulatory risk mapping and what it produces
The operational case for regulatory risk mapping is straightforward: organizations that maintain a current, linked map enter audits with evidence already organized rather than scrambling to reconstruct it. Audit readiness is the most immediate benefit, but it is far from the only one.
Immediate operational benefits:
- Traceability from obligation to evidence, which satisfies regulator requests in hours rather than days
- Identification of control gaps before an inspection surfaces them
- Prioritized remediation lists that direct limited compliance resources to highest-exposure areas
- Faster onboarding for new project managers who inherit a documented obligation set
Strategic benefits:
- Early warning for regulatory change — when used as a monitoring system rather than an audit artifact, the map allows leadership to anticipate cost and competitive impacts from proposed rulemaking
- Resource prioritization grounded in scored risk rather than institutional habit
- A defensible record that demonstrates good-faith compliance effort, which courts and regulators weigh in enforcement proceedings
Key insight: Organizations that treat regulatory risk mapping solely as an audit preparation tool miss its most consequential function. When leadership reviews the map quarterly, they can see which regulatory changes on the horizon will affect capital allocation, project timelines, and subcontractor qualification requirements — well before those changes become binding obligations.
The strategic value compounds over time. A map that has been maintained through two or three regulatory cycles contains institutional memory that no individual compliance officer carries alone.
How to build a regulatory risk map from scoping to monitoring
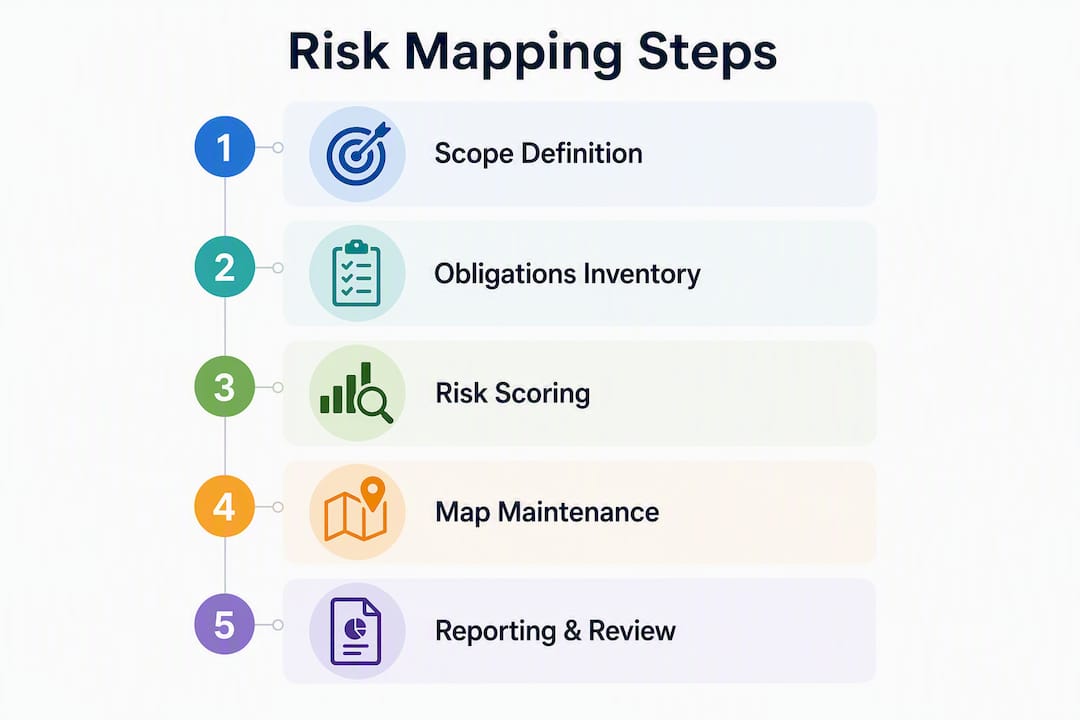
A repeatable build process follows seven ordered steps. The first pilot should cover a single scope unit; the methodology then scales without structural change.
Step-by-step build process
-
Define scope and stakeholders. Select the product line, facility, geography, or project phase to map. Identify which regulators have jurisdiction (federal, state, local) and which internal functions hold relevant knowledge (legal, operations, HSE, procurement).
-
Identify regulators and obligations. Compile every applicable statute, regulation, permit condition, license term, and enforcement guidance. Federal sources include OSHA, EPA, DOT, and sector-specific agencies; state equivalents vary by jurisdiction.
-
Inventory affected processes and systems. For each obligation, identify the operational processes where exposure exists. This step requires direct input from project managers and field supervisors — they know which activities generate the exposure.
-
Map obligations to processes and controls. Create the explicit linkage: obligation → process → existing control → evidence type. Where no control exists, flag the gap for remediation planning.
-
Score likelihood and impact. Apply a structured scoring matrix to prioritize the obligation set. Likelihood scores reflect the probability of non-compliance given current control strength; impact scores reflect the consequence severity (financial penalty, operational shutdown, reputational damage, injury).
-
Assign owners and remediation plans. Every scored risk above the threshold requires a named owner, a remediation action, and a target completion date. Ownership without a deadline is accountability without teeth.
-
Implement monitoring and reporting. Establish the cadence for control testing, map updates, and executive reporting. Monitoring triggers should be both scheduled and event-driven (new site, new regulation, enforcement action against a peer organization).
Scoring matrix guidance
| Likelihood Score | Description | Impact Score | Description |
|---|---|---|---|
| 1 | Remote (control strong, history clean) | 1 | Negligible (minor admin correction) |
| 2 | Unlikely (control adequate, occasional gaps) | 2 | Minor (small fine, correctable) |
| 3 | Possible (control partial or untested) | 3 | Moderate (significant fine, operational disruption) |
| 4 | Likely (control weak or absent) | 4 | Major (license risk, project shutdown) |
| 5 | Near-certain (no control, known gap) | 5 | Critical (criminal exposure, fatality) |
A combined score of 12 or above (on a 25-point scale) typically triggers mandatory remediation with board-level visibility. Scores of 6–11 require documented mitigation plans. Scores below 6 are monitored but not escalated.
Control assessment must evaluate both design strength (is the control theoretically capable of meeting the obligation?) and operating effectiveness (is it actually being used, and is evidence being generated?). Residual risk is inherent risk adjusted for control effectiveness — a well-designed control that nobody follows produces a residual risk nearly as high as having no control at all.
Roles and responsibilities
| Role | Primary Responsibility |
|---|---|
| Compliance / HSE Lead | Obligations inventory, scoring, map maintenance |
| Legal Counsel | Regulatory interpretation, enforcement monitoring |
| Operations / Project Manager | Process validation, control confirmation, evidence collection |
| Control Owner | Day-to-day control operation and evidence generation |
| Executive Sponsor | Escalation decisions, resource allocation, board reporting |

Pro Tip: Engaging on-site staff during the mapping exercise — not just reviewing their work afterward — is the single most reliable way to discover controls that exist on paper but not in practice. Schedule 30-minute field walkthroughs rather than email surveys.
Which standards and frameworks should your map align with?
Three frameworks dominate U.S. regulatory risk mapping practice, and they are complementary rather than competing.
ISO 37301 (Compliance Management Systems) provides the structural architecture. It requires organizations to identify applicable compliance obligations, assess compliance risks, and integrate the map into a documented compliance management system. ISO 37301 certification is increasingly requested by large project owners as a contractor qualification criterion. The standard’s Annex A guidance on obligation identification maps directly onto Steps 1–3 of the build process above.
COSO Enterprise Risk Management Framework situates regulatory risk within the broader enterprise risk universe. COSO’s risk categorization structure (strategic, operational, reporting, compliance) provides a ready-made taxonomy for organizing the map’s output and feeding it into corporate risk registers. Organizations already using COSO for financial reporting risk will find the integration straightforward.
NIST Cybersecurity Framework (CSF) applies specifically where regulatory obligations include data protection requirements (HIPAA, state privacy laws, federal contractor cybersecurity standards). NIST’s control families (Identify, Protect, Detect, Respond, Recover) serve as map categories for technology-related obligations.
For U.S. construction organizations specifically, OSHA’s construction standards (29 CFR Part 1926) and EPA’s stormwater and hazardous waste regulations are the highest-frequency obligation sources. State-level equivalents (Cal/OSHA, for example) layer additional requirements that must be captured in the scope definition. A construction-specific risk assessment framework that aligns with these regulatory sources accelerates the obligations inventory considerably.
| Framework | Primary Application in Mapping |
|---|---|
| ISO 37301 | Obligations identification, compliance system integration, certification evidence |
| COSO ERM | Risk categorization, enterprise register integration, board reporting |
| NIST CSF | Technology and data-related regulatory controls |
| OSHA 29 CFR 1926 | Construction-specific obligation source and control standard |
When do you need RegTech tools versus a spreadsheet?
The honest answer: a well-structured spreadsheet handles a pilot covering fewer than 50 obligations across a single jurisdiction. Beyond that threshold, manual approaches introduce version-control failures, broken traceability links, and evidence gaps that surface at the worst possible moment.
Must-have features for purpose-built RegTech or GRC platforms:
- Obligations library with pre-loaded regulatory content and update alerts
- Traceability linking from obligation through process, control, and evidence
- Workflow management for remediation tasks and owner notifications
- Evidence capture and document storage integrated with the map
- Reporting dashboards for compliance leaders and executive audiences
- Audit trail showing who changed what and when
Comparison of approaches:
| Approach | Best For | Key Limitation |
|---|---|---|
| Manual spreadsheet | Pilots, single-jurisdiction, under 50 obligations | Version control, no automated alerts, evidence stored separately |
| Hybrid (spreadsheet + document management) | Small compliance teams, 50–150 obligations | Traceability breaks when files are renamed or moved |
| Purpose-built GRC / RegTech platform | Multi-jurisdiction, 150+ obligations, frequent regulatory change | Implementation cost and configuration time |
Selection criteria scale with organizational complexity. The number of distinct regulators, the frequency of regulatory change in the sector, the number of geographies, and the volume of evidence that must be retained all push toward purpose-built tooling. Integration with existing systems (project management platforms, HR systems for training records, document management repositories) is a critical evaluation criterion that many teams underweight during procurement.
Automation of evidence capture — where inspection checklists, training completions, and signed logs flow directly into the map rather than being uploaded manually — is the feature that most directly reduces the administrative burden on field teams.
What outputs does a completed map produce?
Risk maps are typically visualized as heat maps or matrices where likelihood and impact scores determine priority. But the heat map is one output among several, and it is not always the most operationally useful.
Core deliverables:
- Regulatory register: the master list of all applicable obligations, their sources, and their current status
- Risk register: the scored inventory of compliance risks, ranked by residual risk score
- Controls matrix: the catalog linking each obligation to its designated control(s) and evidence requirements
- Traceability map: the visual or tabular chain from obligation through process, control, evidence, and owner
- Evidence trail: the collected documentation proving controls operated during the period under review
Example heat map layout
| Impact 1 | Impact 2 | Impact 3 | Impact 4 | Impact 5 | |
|---|---|---|---|---|---|
| Likelihood 5 | 5 | — | — | — | 25 |
| Likelihood 4 | 4 | 8 | 12 | 16 | — |
| Likelihood 3 | 3 | 6 | 9 | 12 | — |
| Likelihood 2 | 2 | 4 | 6 | 8 | — |
| Likelihood 1 | 1 | 2 | 3 | 4 | 5 |
Cells shaded in bold represent scores at or above 12 — the mandatory escalation threshold in the scoring matrix above. Each cell in the heat map should be populated with the specific obligation name or ID, not just a number, so the map is operationally navigable rather than abstractly illustrative.
Executive dashboard KPIs:
| Metric | Description |
|---|---|
| Top — residual risks | Ranked list of highest-scored obligations for board review |
| % controls tested (period) | Proportion of mapped controls with evidence of operation |
| Overdue remediation actions | Count and aging of actions past target completion date |
| Evidence completeness rate | % of obligations with current, retrievable evidence on file |
| Regulatory change alerts (open) | Count of proposed rules under monitoring, by impact score |
How to govern the map and keep it current
A map that is accurate on the day it is built and stale six months later is a liability, not an asset. Governance converts a one-time exercise into a continuous compliance function.
Roles checklist:
- Map owner (Compliance / HSE Lead): accountable for overall accuracy, update scheduling, and reporting to the executive sponsor
- Control owners (operational managers, site supervisors): responsible for day-to-day control operation and evidence generation
- Legal / regulatory monitoring function: responsible for tracking proposed rulemaking and triggering map updates
- Executive sponsor: receives escalated risks, approves resource allocation for remediation, presents to the board
- Internal audit: independently tests control effectiveness and validates evidence completeness
Cadence table:
| Review Type | Frequency | Trigger Events |
|---|---|---|
| Operational control check | Weekly / daily (high-risk controls) | Site activity, new subcontractors |
| Risk score review | Quarterly | Control test results, near-misses |
| Obligations inventory update | Semi-annual | Regulatory monitoring alerts |
| Full map deep review | Annual | Organizational restructure, new geographies |
| Event-driven update | As needed | New rule, enforcement action, incident |
Mapping must be treated as a continuous lifecycle: update triggers should include both operational changes (new sites, new service lines) and regulatory events (rule changes, enforcement actions against peer organizations). A purely scheduled cadence misses the event-driven updates that matter most.
KPIs for map health:
- Time-to-remediate for high-scored risks (target: within defined SLA by risk tier)
- Percentage of controls with evidence tested in the current period
- Evidence completeness rate across the obligation set
- Number of regulatory change alerts reviewed and dispositioned within 30 days
- Percentage of control owners who have confirmed their evidence is current
What does implementation actually cost and how long does it take?
Realistic timelines depend on scope, data quality, and tooling choice. Three scenarios cover most organizational situations.
Timeline scenarios:
- Small pilot (single process or project, under 50 obligations): 6–8 weeks from scope definition to a functioning map with scored risks and assigned owners
- Scaled program (one business unit or geography, 50–200 obligations): 3–9 months, including tooling selection, obligations inventory, stakeholder workshops, and first control testing cycle
- Enterprise rollout (multiple jurisdictions, 200+ obligations, GRC platform integration): 9–18 months, with phased deployment by business unit or geography
Primary cost drivers:
- Number of distinct regulations and regulators in scope
- Number of geographies and the degree of regulatory variation between them
- Current data quality — organizations with no existing obligations inventory spend significantly more on the initial discovery phase
- Tooling choice — purpose-built GRC platforms carry licensing and configuration costs that spreadsheet approaches do not
- Integration requirements with existing project management, HR, and document management systems
- Specialist hours for regulatory interpretation and control design
Building a simple ROI case requires three inputs: the estimated cost of a regulatory fine or enforcement action in the highest-scored risk area, the estimated probability of that event without the map, and the annual cost of maintaining the map. For construction organizations, a single OSHA willful violation carries a maximum penalty of $16,550 per violation as of current federal schedules — a figure that typically exceeds the annual cost of maintaining a well-structured compliance map for a mid-sized contractor.
Integrating risk mapping early in the project lifecycle — during design and pre-construction rather than after mobilization — reduces the cost of control implementation because design changes are cheaper than field modifications.
Common pitfalls and how to avoid them
A compliance risk map without an actionable control and follow-up plan becomes a “pretty chart” that adds little organizational resilience. The failure modes are consistent across industries and organization sizes.
What not to do:
- Map in isolation within the compliance function without operational validation — field staff are the source of truth for whether controls actually operate
- Treat the completed map as the end product rather than the start of a monitoring cycle
- Score risks without testing controls — a high-design-strength control with no evidence of operation scores as a gap, not a mitigation
- Assign ownership to job titles rather than named individuals — accountability requires a person, not a role
- Build the map in a format that only the compliance team can read or update
What to do instead:
- Involve project managers and site supervisors in the mapping workshops, not just the review sign-off
- Design evidence collection into routine operational workflows so audits can be supported without retrospective reconstruction
- Set a mandatory review trigger for any regulatory change alert, regardless of the scheduled cadence
- Publish a simplified version of the heat map to operational leaders so they understand their exposure profile
- Test at least one control per obligation per review period and record the result
Inspection readiness checklist — what regulators expect to see:
- Current regulatory register with obligation sources cited
- Scored risk register with residual risk calculations documented
- Controls matrix with design descriptions and evidence references
- Evidence files organized by obligation (training records, inspection logs, permits, signed checklists)
- Remediation action log with completion dates and responsible owners
- Record of the last map review date and who conducted it
How regulatory risk mapping applies in construction — and what MOSAIC brings
Construction projects generate one of the densest regulatory obligation sets of any industry: building permits, OSHA safety standards, EPA stormwater and hazardous materials requirements, state environmental permits, subcontractor qualification obligations, and insurance requirements all operate simultaneously on a single site. For high-stakes sectors such as construction, regulators expect tangible, up-to-date, defensible evidence that controls are working — not a summary document prepared the week before an inspection.
The mapping structure for a construction project follows the same seven-step process, applied to the project’s regulatory universe:
- Permits and approvals: building permits, grading permits, environmental permits — each with specific conditions that must be tracked as obligations
- OSHA safety standards: fall protection, scaffolding, excavation, hazard communication — each mapped to the site activities where exposure exists
- Environmental controls: SWPPP implementation, hazardous waste handling, dust and noise controls
- Subcontractor obligations: insurance certificates, safety qualification records, training documentation for specialty trades
Client evidence collection template for construction sites:
| Evidence Type | Collection Point | Frequency | Owner |
|---|---|---|---|
| Signed daily safety inspection log | Site supervisor | Daily | Site Superintendent |
| Toolbox talk attendance record | Pre-work briefing | Per activity | Foreman |
| Subcontractor qualification file | Pre-mobilization | Per subcontractor | Project Manager |
| SWPPP inspection report | Site perimeter | Weekly | Environmental Lead |
| Training completion records | HR / LMS system | Per requirement | HSE Manager |
Pro Tip: Design the map to produce compliance evidence as a byproduct of daily operations — build checklists, training records, and signed logs into normal site routines so that when a regulator arrives, the evidence file is already complete.
MOSAIC Ecoconstruction Solutions provides QES consultancy, safety auditing, and regulatory compliance support specifically for construction organizations. MOSAIC’s service scope covers obligations inventory development, control design, audit evidence preparation, and certification support under frameworks including ISO 37301 and BizSAFE.
Key Takeaways
Regulatory risk mapping is only as valuable as the governance structure that keeps it current, the evidence it produces, and the operational ownership that makes controls real rather than theoretical.
| Point | Details |
|---|---|
| Start with a scoped pilot | Select one process or geography, build the obligations inventory first, then score and assign owners. |
| Link obligation to evidence | Every mapped obligation needs a named control, a specified evidence type, and a named owner — not just a risk score. |
| Use event-driven updates | Regulatory changes and operational events (new sites, new services) must trigger map updates, not just the annual review cycle. |
| Align to ISO 37301 or COSO | Framework alignment makes the map auditable and compatible with enterprise risk programs and certification requirements. |
| MOSAIC accelerates the build | MOSAIC’s QES consultancy and audit support services help construction teams move from obligations inventory to a defensible, evidence-backed map faster than internal-only efforts typically allow. |
The gap between a risk map and a compliance program
The conventional wisdom in compliance circles holds that completing a regulatory risk map is a significant achievement. That framing is worth examining critically, because it locates the value in the artifact rather than in what the artifact enables.
A map that accurately scores 200 obligations and assigns owners to every one of them has accomplished the analytical work. What it has not done is change a single operational behavior. The controls still need to operate. The evidence still needs to be generated. The owners still need to act when a score crosses the escalation threshold. The map is the specification; the compliance program is the execution.
The teams that extract the most value from regulatory risk mapping are the ones that treat the map as a management tool rather than a compliance document. They review it in operational meetings, not just compliance reviews. They update it when a project scope changes, not only when a regulation changes. They use it to brief new project managers on their obligation set before mobilization, not after the first inspection.
The other underappreciated dimension is the distinction between design effectiveness and operating effectiveness in control assessment. Many organizations score their controls based on what the control is designed to do. The more revealing question is whether the control is actually operating and whether evidence of that operation exists. A guardrail specification in a safety plan is a designed control. A signed daily inspection log confirming the guardrail was in place and undamaged is operating evidence. Regulators want the second document, not the first.
MOSAIC’s regulatory compliance services for construction teams
Construction organizations managing complex, multi-jurisdictional regulatory obligations need more than a template — they need a structured methodology, sector-specific expertise, and a partner who understands what evidence regulators actually examine. MOSAIC Ecoconstruction Solutions delivers exactly that: a complete QES consultancy service that takes construction teams from obligations inventory through control design, audit evidence preparation, and certification support.

MOSAIC’s consultants have direct experience building regulatory maps for construction projects operating under OSHA, EPA, and state-level safety and environmental frameworks. The service covers the full mapping lifecycle: scoping workshops, obligations identification, control gap analysis, evidence collection design, and ongoing audit support. For organizations pursuing BizSAFE Star certification or ISO 37301 alignment, MOSAIC’s structured approach produces the documented evidence trail that certification auditors require. Contact MOSAIC to schedule a scoping consultation and determine the right pilot scope for your organization.
Useful sources and further reading
The following primary sources and authoritative guides support the methodology and sector guidance in this article:
- Managing Regulatory Risk (IRM Guide) — The Institute of Risk Management’s foundational guide on regulatory risk process design, governance, and evidence expectations; best for methodology and governance sections.
- Regulatory Compliance Risk Assessment (Financial Crime Academy) — Detailed guidance on control design effectiveness versus operating effectiveness and the role of operational staff in validation; best for scoring and control-testing methodology.
- Regulatory Risk Definition (Investopedia) — Authoritative definition distinguishing regulatory risk from compliance risk; best for definitional clarity and stakeholder communication.
- Risk Mapping, Assessment and Planning (FEMA) — Federal reference for risk mapping methodology applicable to environmental and site-specific regulatory obligations in construction.
Recommended
- Regulatory Compliance Best Practices for Professionals in 2026
- WSH Risk Management Regulations 2026: Are Your Safety Assessments Updated? – MOSAIC Eco-construction Solutions Pte Ltd
- The Definitive 2024 Guide to Implementing a Risk Management Framework in Your Singapore Business: From ISO 31000 to MAS & ACRA Compliance – MOSAIC Eco-construction Solutions Pte Ltd