
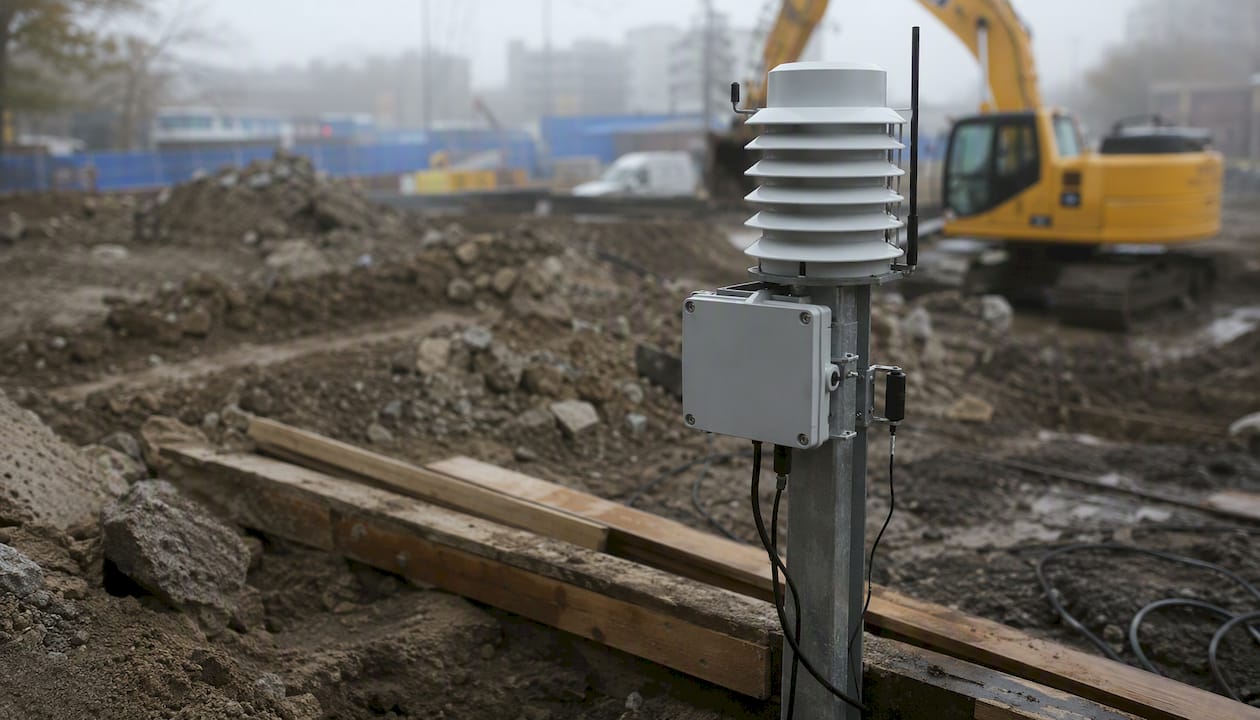
Environmental monitoring is the systematic, ongoing process of collecting and analyzing data on environmental conditions to characterize the environment, detect trends, assess regulatory compliance, and inform management decisions. It is not a one-off measurement but a disciplined, repeatable program of observations conducted on a predetermined schedule. The primary categories span air quality, water quality, soil and sediment, biodiversity and ecological health, noise and meteorology, and emissions or process monitoring. Without sound observational data, decisions about public health protection, regulatory compliance, and operational risk reduction rest on conjecture rather than evidence — a liability no responsible organization can afford.
The main monitoring types at a glance:
- Air quality: particulate matter (PM2.5), ozone, nitrogen oxides (NOx), volatile organic compounds
- Water quality: pH, dissolved oxygen, nutrients (nitrate, phosphorus), turbidity, pathogens
- Soil and sediment: heavy metals, salinity, organic contaminants, erosion indicators
- Biodiversity and ecological: species counts, habitat condition indices, macroinvertebrate assemblages
- Noise and meteorology: decibel levels, wind speed and direction, temperature, precipitation
- Emissions and process: stack emissions, effluent concentrations, fugitive dust
Monitoring programs underpin EPA regulatory programs, drive public health alerts through platforms such as AirNow, and give construction and industrial operators the data they need to demonstrate compliance and reduce operational risk.
Key Takeaways
Environmental monitoring is a systematic, scheduled process of data collection and analysis that supports compliance demonstration, trend detection, and management decisions — not a one-off snapshot.
| Point | Details |
|---|---|
| Core definition | Environmental monitoring is the systematic, ongoing collection and analysis of environmental data to detect trends, verify compliance, and inform decisions. |
| Six main types | Air, water, soil/sediment, biodiversity/ecological, noise/meteorology, and emissions/process monitoring each target distinct receptors and regulatory thresholds. |
| Program design essentials | Start with defined objectives and monitoring hypotheses; set decision rules and action levels; document everything in a QAPP before sampling begins. |
| National program examples | CASTNET, NADP, and AirNow provide long-term, publicly accessible datasets that demonstrate how sustained monitoring translates into policy-relevant evidence. |
| MOSAIC QES support | MOSAIC Ecoconstruction Solutions designs site-specific monitoring plans, QAPPs, and audit programs for construction projects requiring defensible compliance documentation. |
Table of Contents
- What are the main types of environmental monitoring?
- How environmental monitoring is actually conducted
- Key parameters and indicators measured in monitoring programs
- Why environmental monitoring matters: uses and benefits
- How to design a defensible monitoring program
- Technologies and tools used in modern monitoring programs
- What monitoring cannot do: challenges and limitations
- How to interpret monitoring data and produce actionable reports
- Construction-site environmental monitoring: how QES specialists deliver it
- The U.S. legal and regulatory framework governing environmental monitoring
- Why defensible monitoring plans are the non-negotiable foundation
- MOSAIC’s QES consultancy supports your monitoring program from design to reporting
- Sources
What are the main types of environmental monitoring?
Environmental monitoring spans several distinct media and disciplines, each targeting different receptors and regulatory thresholds.
Air quality monitoring tracks criteria pollutants — PM2.5, PM10, ozone, NOx, sulfur dioxide, and carbon monoxide — alongside hazardous air pollutants at ambient monitoring stations. A typical application is a state agency operating a network of Federal Reference Method monitors to demonstrate attainment with National Ambient Air Quality Standards (NAAQS).
Water quality monitoring covers surface water, groundwater, and drinking water systems. Parameters include pH, dissolved oxygen, biochemical oxygen demand (BOD), nutrients, turbidity, and microbial indicators. A municipal utility, for example, monitors source water daily for turbidity and coliform bacteria to protect treatment plant performance and comply with Safe Drinking Water Act requirements.
Soil and sediment monitoring focuses on heavy metals (lead, cadmium, arsenic), persistent organic pollutants, salinity, and physical properties such as compaction. Contaminated-site investigations under CERCLA routinely require soil sampling grids to delineate plume boundaries and track remediation progress.
Biodiversity and ecological monitoring uses species inventories, habitat condition indices, and biological integrity metrics — macroinvertebrate assemblages in streams, for instance — to assess ecosystem health beyond what chemical parameters alone reveal.
Noise and meteorological monitoring quantifies community noise exposure in dB(A) and tracks wind, temperature, and precipitation data that influence pollutant dispersion and receptor exposure. Construction projects near sensitive receptors frequently require continuous noise loggers at site boundaries.
Emissions and process monitoring includes continuous emissions monitoring systems (CEMS) on industrial stacks, effluent flow and concentration monitoring at permitted discharge points, and fugitive dust monitoring on active earthworks.
Hybrid or cross-media monitoring networks link air and water chemistry to understand atmospheric deposition pathways. CASTNET, LTM, and NADP collectively have provided data for more than 30 years, forming the backbone of national trend assessments for acid deposition and nitrogen loading. The National Atmospheric Deposition Program (NADP) specifically provides wet deposition data for sulfur, nitrogen, and mercury, complementing dry-deposition networks to build a complete picture of atmospheric inputs to ecosystems.
How environmental monitoring is actually conducted
Sampling design: the foundation
Every defensible monitoring program begins with a sampling design that matches the program’s objectives. Location selection must balance representativeness — capturing conditions across the site or study area — against the need to identify hotspots where concentrations are likely highest. Frequency is equally critical: a quarterly grab sample may miss seasonal peaks that drive regulatory exceedances, while continuous monitoring at a single point may miss spatial variability across a large site.
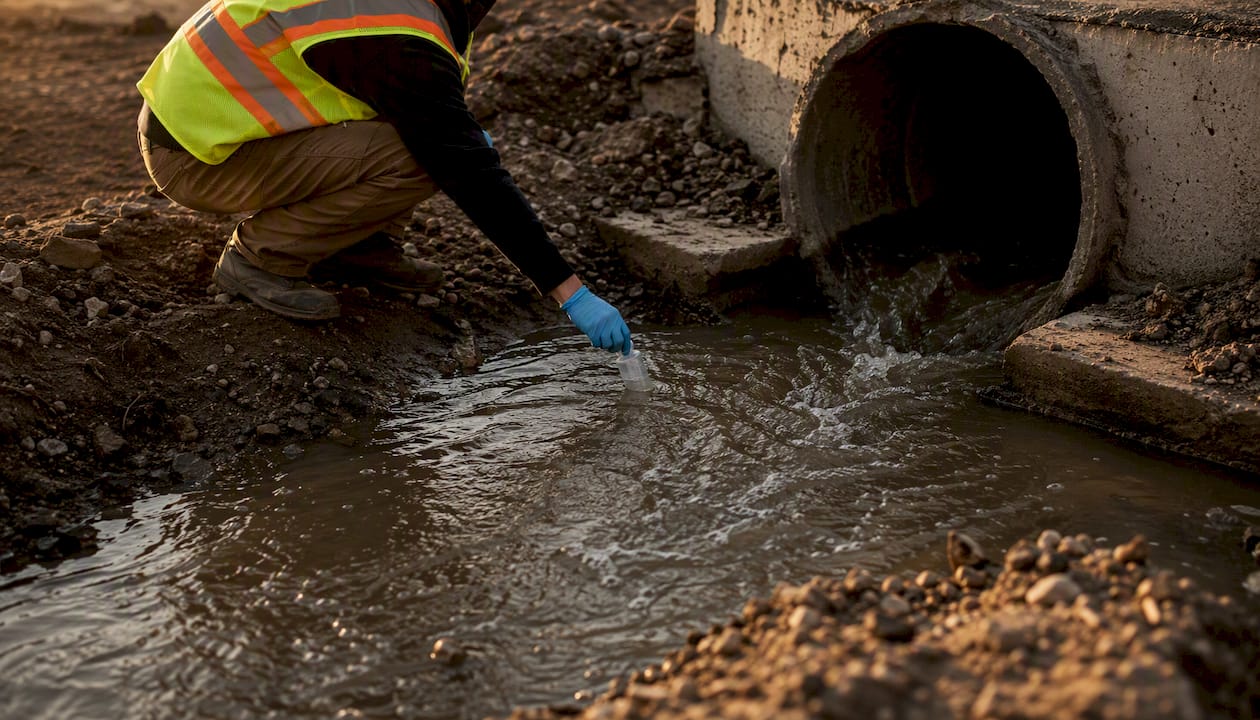
Practitioner guidance recommends worst-case timing and funnel-point sampling to ensure results are representative of peak conditions rather than average ones. A funnel point is a location where contamination from multiple sources converges — a storm drain outlet, a site boundary downwind of active earthworks — making it the most efficient place to detect a problem if one exists.
Sampling methods compared
| Method | Strengths | Limitations | Best Use Case |
|---|---|---|---|
| Grab sampling | Simple, low cost, captures point-in-time conditions | Misses temporal variability; single snapshot | Compliance spot-checks, initial site characterization |
| Composite sampling | Averages variability over time or space; reduces lab costs | Masks peak concentrations; complex field logistics | Effluent monitoring, soil averaging across a grid |
| Continuous real-time sensors | High temporal resolution; enables automated alerts | Higher capital cost; calibration and maintenance demands | Air quality networks, water quality telemetry, noise logging |
| Remote sensing (satellite/drone) | Large spatial coverage; non-invasive; repeatable | Coarser resolution; indirect measurement; validation required | Land cover change, thermal anomalies, vegetation stress |
| Biological monitoring (bioassays, bioindicators) | Integrates cumulative exposure; ecologically relevant | Taxonomic expertise required; slower turnaround | Ecological health assessments, receiving water quality |
Lab analysis and QA/QC
Field samples collected under any method require rigorous chain-of-custody documentation from collection through laboratory analysis. Every sample container must be labeled, sealed, and accompanied by a chain-of-custody form that records each transfer of possession. Laboratories operating under EPA-approved methods apply internal QA/QC checks — method blanks, matrix spikes, duplicate analyses — to confirm that results are accurate and defensible. Without these controls, data may be challenged in regulatory or legal proceedings.
Pro Tip: Schedule monitoring events to coincide with worst-case operational conditions — peak traffic, active grading, post-storm runoff — rather than routine periods. Data collected during average conditions systematically underestimates peak exposures and may fail to trigger required corrective actions.
Key parameters and indicators measured in monitoring programs
The parameters a program measures should be selected directly from its management objectives, not from a generic checklist. The table below maps common parameters to their typical units and the reason each is measured.
| Parameter | Typical Units | Why It Is Measured |
|---|---|---|
| PM2.5 (fine particulate matter) | µg/m³ | NAAQS compliance; public health (respiratory and cardiovascular effects) |
| Ozone (O₃) | ppb | NAAQS compliance; crop and ecosystem damage assessment |
| Nitrate (NO₃⁻) | mg/L | Eutrophication risk; drinking water standard (10 mg/L MCL) |
| pH | Dimensionless | Aquatic ecosystem health; corrosivity of water to infrastructure |
| Dissolved oxygen (DO) | mg/L | Aquatic life support; indicator of organic loading |
| Lead (Pb) in soil | mg/kg | Human health risk at contaminated sites; RCRA and CERCLA compliance |
| Total suspended solids (TSS) | mg/L | Sediment runoff control; turbidity in receiving waters |
| Noise level (LAeq) | dB(A) | Community impact assessment; occupational and construction-site compliance |
| Listeria spp. | Presence/absence | Sanitation verification in food and processing facilities |
An important distinction separates indicator parameters from target analytes. Total coliform bacteria, for example, serve as an indicator of fecal contamination in drinking water; the actual target concern is pathogens such as E. coli O157:H7 or Cryptosporidium. Monitoring programs often use indicators because they are faster, cheaper, and easier to detect, while targeted analyte testing is reserved for confirmation or risk assessment. Virginia Tech’s guidance on environmental monitoring programs in food facilities illustrates this principle clearly: indicator organisms signal whether a sanitation system is functioning, not whether a specific pathogen is present.
Regulatory benchmarks exist for many parameters — the EPA’s Maximum Contaminant Levels (MCLs) for drinking water, NAAQS for criteria air pollutants, and RCRA soil screening levels for hazardous waste sites — and these thresholds should be built directly into a program’s decision rules.
Why environmental monitoring matters: uses and benefits
Monitoring provides the objective observations required for informed environmental decision-making; without sound data, decisions default to conjecture. The practical applications span regulatory, public health, conservation, and commercial domains.
Regulatory compliance is the most immediate driver for most organizations. Permitted facilities must demonstrate that emissions or discharges remain within permitted limits; monitoring data is the evidence. Failure to produce defensible data can result in permit violations, enforcement actions, and civil liability.
Trend detection is where long-term programs deliver their most significant value. CASTNET, the Long-Term Monitoring (LTM) program, and NADP have tracked acid deposition and nitrogen loading across the eastern United States for decades, providing the evidence base that demonstrated the effectiveness of the Clean Air Act Amendments of 1990 in reducing sulfur dioxide emissions. No single snapshot measurement could have established that causal relationship.
Public health protection depends on near-real-time monitoring outputs. AirNow distributes Air Quality Index (AQI) data and health guidance to communities across the country, enabling schools, hospitals, and individuals to make informed decisions on days when ozone or PM2.5 reaches unhealthy levels.
Conservation and ecosystem management rely on biodiversity and ecological monitoring to detect population declines, invasive species establishment, and habitat degradation before they become irreversible. The EPA’s National Aquatic Resource Surveys use probabilistic sampling designs to produce statistically defensible national estimates of stream, lake, and wetland condition.
Business risk reduction and cost savings are increasingly prominent motivations. Environmental monitoring helps businesses maintain legal compliance, identify resource waste for cost savings, enhance reputation with stakeholders, and proactively mitigate environmental risks. A construction contractor who monitors sediment runoff in real time, for example, can intervene before a turbidity exceedance triggers a stop-work order — avoiding project delays that cost far more than the monitoring program itself.
Stakeholders who rely on monitoring data include federal agencies (EPA, USGS, NOAA), state environmental agencies, municipal utilities, industrial permit holders, academic researchers, community organizations, and private-sector operators managing environmental liability.
How to design a defensible monitoring program
A monitoring program that cannot support a management decision is an expensive exercise in data collection. A defensible program starts with clear objectives and monitoring hypotheses, includes decision rules and a Quality Assurance Project Plan (QAPP), and is structured so that data directly support management decisions. The EPA’s guidance frames this as a six-step iterative framework.
The six-step framework
-
Define management objectives. State precisely what decision the monitoring data must support — compliance demonstration, trend detection, verification of mitigation effectiveness, or baseline characterization. Vague objectives produce programs that generate data no one can act on.
-
Develop monitoring hypotheses. Translate each objective into a testable statement: “Sediment concentrations at the site boundary will not exceed 50 mg/L TSS during active grading operations.” This framing forces precision about what parameters matter, at what locations, and at what thresholds.
-
Choose sampling design and parameters. Select locations, frequency, methods, and analytes based on the hypotheses. Apply worst-case timing and funnel-point logic. Confirm that the chosen analytical methods can detect parameters at the concentrations that matter for the decision.
-
Set decision rules and action levels. Define the specific trigger that initiates a response: “If TSS exceeds 50 mg/L at monitoring point MP-3 on two consecutive sampling events, implement additional sediment controls within 48 hours and resample within 72 hours.” Decision rules must specify the action level, the required verification sampling, and the corrective actions.
-
Develop QA/QC procedures and the QAPP. The QAPP documents the program’s objectives, sampling design, analytical methods, QA/QC requirements, data management procedures, and reporting schedule. It is the contract between the program and its data users — regulators, legal counsel, or management — that the data are scientifically defensible. At hazardous waste sites, a QAPP is typically required before any sampling begins.
-
Implement, analyze, and iterate. Collect samples, analyze data, and evaluate whether the results support or refute the monitoring hypotheses. Revisit decision rules when conditions change, new information emerges, or the program’s objectives evolve.
Pro Tip: Frame every monitoring question around a specific outcome: “Does this data demonstrate compliance?” or “Does this data show the mitigation measure is working?” Programs designed to answer a specific question produce data that decision-makers can act on. Programs designed to “monitor the environment generally” produce archives.
Technologies and tools used in modern monitoring programs
Modern environmental monitoring draws on a spectrum of technologies, each occupying a distinct position on the accuracy-cost-coverage continuum.
-
Low-cost sensors and data loggers: Electrochemical and optical sensors for air quality (PM2.5, CO, NO₂), temperature, humidity, and water quality (pH, DO, conductivity) have dropped significantly in price. They are well-suited for screening surveys, spatial mapping, and community monitoring networks, but their accuracy typically falls short of regulatory reference methods. Use them to identify hotspots and prioritize targeted sampling, not to generate permit-compliance data.
-
Reference-grade instruments: Federal Reference Method (FRM) and Federal Equivalent Method (FEM) monitors for air quality, and EPA-approved methods for water and soil analysis, produce data defensible for regulatory compliance. Higher capital and operating costs are offset by legal defensibility.
-
Remote sensing (satellite and drone): Satellite platforms such as NASA’s MODIS and Landsat provide land cover, vegetation index, and thermal data at regional to global scales. Drone-mounted sensors extend this capability to site-specific applications — mapping erosion on a construction site, assessing vegetation recovery after remediation, or detecting thermal anomalies at industrial facilities. Spatial resolution and revisit frequency vary significantly by platform.
-
Autosamplers: Automated water samplers collect time- or flow-proportional samples at unattended locations, enabling composite sampling during storm events when manual collection is impractical. They are standard equipment for stormwater permit compliance monitoring.
-
Bioassays and biological monitoring: Whole-effluent toxicity (WET) tests, macroinvertebrate surveys, and fish tissue sampling provide ecologically integrated measures of environmental condition that chemical analysis alone cannot capture.
-
Laboratory analytical platforms: Gas chromatography-mass spectrometry (GC-MS) identifies and quantifies organic contaminants; inductively coupled plasma-mass spectrometry (ICP-MS) measures trace metals at sub-ppb concentrations. These platforms underpin the analytical precision that regulatory compliance requires.
-
Data platforms and telemetry: Real-time data transmission via cellular or satellite telemetry enables automated alerts when trigger levels are exceeded. Dashboards aggregate multi-parameter, multi-location data streams and flag exceedances for immediate corrective action. This shift from periodic manual reporting to continuous automated surveillance moves monitoring programs from reactive to preventive modes.
What monitoring cannot do: challenges and limitations
Environmental monitoring is a powerful tool, but practitioners who treat it as a substitute for sound management systems consistently encounter the same failures.
-
Snapshot vs. trend limitation: A single sampling event characterizes conditions at one moment in time. Distinguishing a genuine trend from natural variability requires multiple sampling events over an appropriate time scale — a point that sampling designs frequently underestimate.
-
Sampling bias: Monitoring locations selected for convenience rather than representativeness produce biased datasets. A single upwind background monitor and a single downwind receptor monitor may miss the spatial complexity of a large industrial site.
-
False negatives and false positives: Analytical detection limits, matrix interferences, and field contamination can produce results that misrepresent actual conditions. A non-detect result does not mean a contaminant is absent; it means the contaminant was not detected above the method detection limit.
-
Data quality problems: Broken chain-of-custody, improper sample preservation, exceeded holding times, and inadequate QA/QC documentation render data legally indefensible, regardless of analytical accuracy.
-
Funding and resource constraints: Long-term monitoring programs are chronically underfunded. Gaps in national datasets — missing years, discontinued monitoring stations — compromise trend analyses and reduce the statistical power needed to detect gradual changes.
-
Unclear objectives: Programs designed without specific management questions generate data that no one can act on. Monitoring without a management system to respond to results is operationally inert.
Pro Tip: Triangulate across data sources: combine continuous sensor data, targeted grab or composite sampling, and historical datasets from programs such as CASTNET or NADP. No single data stream is sufficient. Convergence across independent sources substantially reduces the risk of acting on an artifact rather than a real signal.
How to interpret monitoring data and produce actionable reports
Raw monitoring data becomes useful only when it is analyzed in the context of the program’s objectives and decision rules.
-
Trend vs. snapshot: Plot data as a time series before drawing any conclusions. A single exceedance may be an outlier; a directional trend across multiple sampling events is a signal that demands a management response. Control charts — plotting results against upper and lower control limits derived from baseline data — are a practical tool for distinguishing signal from noise in ongoing monitoring programs.
-
Statistical approaches: Descriptive statistics (mean, median, standard deviation, percentiles) characterize the distribution of results. Time-series analysis identifies seasonal patterns and long-term trends. Hypothesis testing — Mann-Kendall trend tests for monotonic trends in water quality data, for example — provides a formal framework for determining whether an observed change is statistically distinguishable from background variability. Monitoring design must distinguish between natural variability and true response; appropriate statistical analysis depends on data characteristics and the monitoring hypotheses.
-
Non-detects: Results below the method detection limit require careful handling. Substituting zero or half the detection limit introduces bias; statistical methods such as Kaplan-Meier or regression on order statistics (ROS) are more appropriate for datasets with a significant proportion of non-detects.
-
Report structure: Effective monitoring reports lead with a clear statement of whether decision rules were triggered, followed by the data summary, trend analysis, uncertainty assessment, and recommended next steps. Burying an exceedance in an appendix table is a common failure that delays corrective action. Stakeholders — regulators, project managers, community representatives — need to understand what the data mean for their decisions, not just what the numbers are.
-
Uncertainty communication: Every monitoring result carries analytical uncertainty. Reports should state the method detection limit, the precision of replicate analyses, and any QA/QC flags that affect data usability. Overstating certainty in monitoring reports erodes credibility when results are later challenged.
Construction-site environmental monitoring: how QES specialists deliver it
Construction sites are among the most demanding environments for monitoring program design. Active earthworks, multiple concurrent operations, variable weather, and proximity to sensitive receptors — waterways, residential areas, ecological habitats — create a dynamic exposure landscape that generic monitoring protocols cannot adequately address. Understanding construction environmental hazards is the prerequisite for designing a monitoring program that actually protects those receptors.
A QES consultant’s first task is translating regulatory and project objectives into a site-specific monitoring plan. That means identifying the critical receptors (a stormwater drain, a neighboring property boundary, a protected waterway), selecting monitoring points that function as funnel points for the most likely contamination pathways, and specifying parameters, frequency, and action levels that align with permit conditions and project risk.
Dust and sediment runoff: a practical case
A monitoring plan for a large earthworks project typically includes:
- Dust monitoring: Continuous particulate monitors (PM10 or TSP) at site boundaries downwind of active grading, with trigger levels set below the permit limit to allow corrective action before an exceedance occurs. Meteorological data (wind speed and direction) are logged simultaneously to support dispersion analysis.
- Sediment runoff monitoring: Turbidity sensors or autosampler installations at stormwater outfall points, with flow-proportional composite sampling during rain events exceeding a defined threshold (e.g., 10 mm in 24 hours). TSS results are compared against permit discharge limits and internal action levels.
- Corrective action triggers: If PM10 at a boundary monitor exceeds the internal trigger level, operations in the upwind work zone are suspended and additional dust suppression (water cart, chemical suppressant) is applied within a defined response window. If TSS at an outfall exceeds the action level, sediment controls (silt fences, sediment basins) are inspected and repaired before work resumes.
Typical consultant deliverables for a construction monitoring program include: a Monitoring Plan document, a QAPP, chain-of-custody procedures, regular compliance reports (weekly or monthly depending on permit requirements), corrective-action documentation, and stakeholder briefings for the project owner, principal contractor, and regulatory authority. Integrating environmental risk mitigation practices into the monitoring plan from project inception — rather than retrofitting controls after an exceedance — is what separates a proactive program from a reactive one.
Safety monitoring on construction sites also intersects with environmental monitoring when ambient conditions (heat, noise, dust) affect worker health, reinforcing the case for integrated QES management rather than siloed programs.
The U.S. legal and regulatory framework governing environmental monitoring
Environmental monitoring in the United States operates within a layered statutory and regulatory framework administered primarily by the EPA, with significant roles for state agencies, the Army Corps of Engineers, and OSHA.
The Clean Air Act (CAA) establishes the NAAQS for six criteria pollutants and requires states to operate ambient air monitoring networks that demonstrate attainment or non-attainment. Title IV of the 1990 CAA Amendments created the Acid Rain Program, which mandated CEMS on large power plant stacks — one of the most extensive continuous emissions monitoring requirements in U.S. history. CASTNET and NADP emerged as the deposition monitoring counterparts to these emissions controls.
The Clean Water Act (CWA) governs water quality monitoring through the National Pollutant Discharge Elimination System (NPDES) permit program. Permitted dischargers must monitor effluent at specified frequencies, report results to the permitting authority, and retain records for a minimum of three years. Construction sites disturbing one or more acres must obtain a Construction General Permit (CGP) that requires stormwater monitoring and best management practice (BMP) implementation.
The Resource Conservation and Recovery Act (RCRA) and the Comprehensive Environmental Response, Compensation, and Liability Act (CERCLA) impose monitoring requirements at hazardous waste facilities and contaminated sites, respectively. RCRA groundwater monitoring programs at permitted facilities follow a structured detection-assessment-corrective action sequence. CERCLA remedial investigations require systematic soil, groundwater, and surface water sampling to characterize contamination and evaluate remedial alternatives.
The Safe Drinking Water Act (SDWA) mandates monitoring of public water systems for regulated contaminants, with monitoring frequency scaled to system size and source water vulnerability. The Lead and Copper Rule, most recently revised in 2021, imposes specific sampling protocols at consumer taps to assess lead and copper exposure.
State and local regulations frequently exceed federal minimums. Many states operate their own ambient air monitoring networks, impose more stringent water quality standards, and require site-specific environmental management plans for construction projects above defined thresholds. Practitioners must verify applicable state requirements — which vary considerably — before finalizing a monitoring program design.
The EPA’s Office of Research and Development and Office of Water publish extensive guidance documents, including QAPP templates and monitoring protocol guidance, that serve as the de facto technical standards for program design across all these regulatory contexts.
Why defensible monitoring plans are the non-negotiable foundation
The most consequential gap in environmental monitoring practice is not technological — it is the persistent failure to connect monitoring design to specific management decisions. Programs are initiated because a permit requires them, a project manager requests them, or a community demands them, yet the monitoring questions are never precisely defined. The result is datasets that accumulate without ever resolving the question that motivated the program.
The principle that monitoring should verify management systems rather than substitute for them applies as directly to a construction site dust program as it does to a food facility sanitation verification program. A dust monitor that triggers an alert is only useful if the site has a documented corrective action procedure, trained personnel to execute it, and a reporting chain that reaches the decision-maker in time to act. The monitoring plan and the management system must be designed together.
Statistical rigor is the second undervalued dimension. Practitioners routinely collect data and compare results to a threshold without accounting for analytical uncertainty, sampling variability, or the statistical power needed to detect a real change. A program that cannot distinguish a genuine trend from background noise is not generating evidence; it is generating the appearance of evidence. Investing in replication, appropriate sampling frequency, and statistical analysis at the design stage is far less expensive than defending a flawed dataset in a regulatory proceeding.
MOSAIC’s QES consultancy supports your monitoring program from design to reporting
Construction organizations that need a monitoring program built to regulatory standards — not assembled from generic templates — benefit from the depth of QES expertise that MOSAIC Ecoconstruction Solutions brings to each engagement. MOSAIC’s consultancy services cover the full program lifecycle: defining management objectives aligned with permit conditions, drafting the QAPP, specifying instrumentation and sampling protocols, conducting field audits, and producing compliance reports that withstand regulatory scrutiny.

Where a project requires a formal safety audit alongside environmental monitoring, MOSAIC integrates both workstreams under a single QES management framework, eliminating the coordination gaps that arise when environmental and safety programs are managed separately. The result is a monitoring program that is technically defensible, operationally practical, and directly tied to the corrective-action procedures your site already has in place. Contact MOSAIC to commission a site-specific monitoring plan or QAPP for your next project.
Sources
The following primary sources are the most authoritative references for environmental monitoring standards, datasets, and program templates in the U.S. context.
- Environmental monitoring – Wikipedia
- Guidance for developing Monitoring Plans (EPA semspub HQ/175500)
- Environmental monitoring and power sector programs | EPA
- NADP
- AirNow
- What is Environmental Monitoring? – IERE
- Introduction to Environmental Monitoring Programs | Virginia Tech (FST-290)