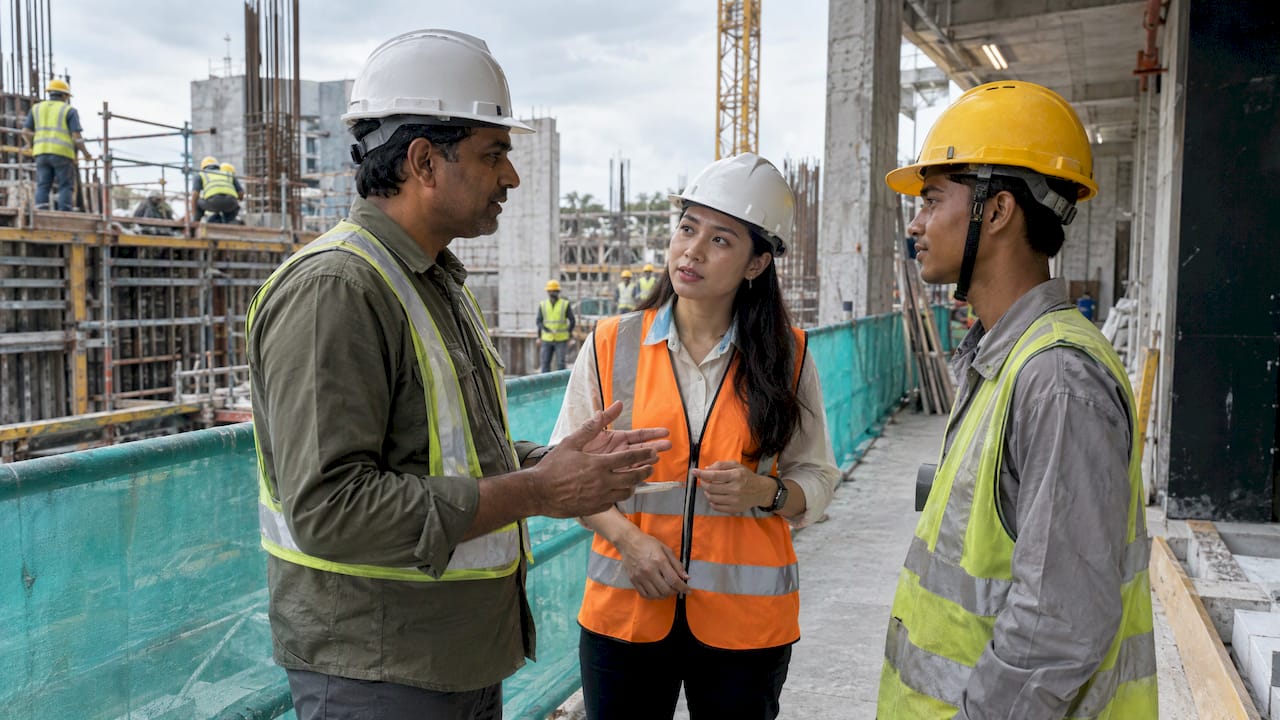

In the first half of 2026, Singapore’s construction sector recorded 69 fatal and major injuries, down from 75 a year earlier, at an annualised rate of 24.1 per 100,000 workers, the lowest since 2020, according to MOM’s 1H2026 WSH Report. Four of those cases were deaths. For a contractor, developer or safety manager, the figures matter less as headlines than as a map: they show which hazards, project types and site sizes keep producing serious harm, and therefore where a safety management system, a bizSAFE programme or a WSH audit has to concentrate its effort. This article sets out the latest official numbers, the multi-year trend, the leading causes and what they mean for compliance planning.
TL;DR
- Construction recorded 69 fatal and major injuries in 1H2026 (75 in 1H2025), a rate of 24.1 per 100,000 workers, and 4 deaths.
- For full-year 2025, construction had 13 deaths (20 in 2024) and 148 fatal and major injuries, a rate of 26.3 per 100,000 workers.
- Slips, trips and falls (19 cases) and falls from height (9 cases) led construction incidents in 1H2026.
- Smaller-scale works account for the majority of serious injuries: 70% in 1H2026.
- Public-sector and private-sector projects both contribute, but private projects account for the larger share.
Table of Contents
- The latest figures: first half of 2026
- Three years of construction data
- What is causing serious construction accidents
- Where the injuries concentrate: smaller-scale works
- Public versus private projects
- Turning the statistics into a compliance plan
- Support for contractors who want their numbers to improve
- FAQ
- Sources
The latest figures: first half of 2026
MOM published its Workplace Safety and Health Report for January to June 2026 on 8 September 2026. Two terms need explaining. A major injury is a serious injury defined in WSH regulations, such as a fracture or an injury requiring extended hospitalisation. The annualised rate converts a six-month count into a yearly figure per 100,000 employed workers, so that sectors of different sizes and periods can be compared.
For construction, the 1H2026 picture is:
- Fatal and major injuries: 69, against 75 in 1H2025.
- Annualised fatal and major injury rate: 24.1 per 100,000 workers, down from 27.6, the lowest since 2020 (MOM press release).
- Workplace fatalities in the sector: 4, three fewer than in 1H2025. The annualised fatal injury rate fell from 2.6 to 1.4 per 100,000 workers.
- Severity profile: all four deaths came from Type A incidents, the category MOM uses for events with a higher risk of fatality.
Across all sectors the first half was less favourable. Singapore recorded 21 workplace deaths, lifting the annualised fatal injury rate to 1.1 per 100,000 workers from 0.97 in 1H2025, and 19 of the 21 were Type A incidents. MOM’s report notes that after seven workers died over four weeks in late May and June, MOM and the Multi-Agency Workplace Safety and Health Taskforce (MAST) stepped up measures, including enhanced penalties and a two-week nationwide voluntary Safety Time-Out.
Two cautions apply when you read half-year figures. First, they are small counts, so a single multi-fatality event moves the rate visibly. Second, MOM revises comparison periods in later reports, which is why year-on-year comparisons should always be taken from the same release rather than mixed from different years’ publications.
Three years of construction data
The full-year reports give the more stable view. The table draws on MOM’s 2024 WSH Report for 2023 and 2024, and on the 2025 WSH Report for 2025.
| Year | Construction deaths | Fatal injury rate (per 100,000) | Fatal and major injuries | Fatal and major injury rate (per 100,000) |
|---|---|---|---|---|
| 2023 | 18 | 3.4 | 167 | 31.9 |
| 2024 | 20 | 3.7 | 166 | 31.0 |
| 2025 | 13 | 2.3 | 148 | 26.3 |
Three readings follow from the table.
2024 was a plateau, not an improvement. The combined fatal and major injury rate slipped only marginally, from 31.9 to 31.0, while deaths rose from 18 to 20. That outcome prompted MAST’s November 2024 voluntary construction safety time-out.
2025 was a clear step down. Deaths fell from 20 to 13 and the fatal injury rate from 3.7 to 2.3. Even so, construction still recorded the most deaths of any industry in 2025, and 135 major injuries, also the most of any sector. At 148 fatal and major injuries, it accounted for 24% of the all-sector total.
Construction is no longer the clear outlier on combined injuries. Its 2025 fatal and major injury rate of 26.3 was below manufacturing’s 28.8. Nationally, MOM reported a record-low overall fatal injury rate of 0.96 per 100,000 workers in 2025 and described Singapore’s workplaces as among the safest globally, alongside countries such as the Netherlands, the UK, Germany and Sweden, which consistently record rates below 1.0.
MOM attributes the improvement to stronger WSH ownership and heightened vigilance after two safety time-outs called by MAST, together with stepped-up enforcement. For 2024 to 2025 it also points to stricter safety requirements for public-sector projects introduced in April 2024 (1H2025 release).
What is causing serious construction accidents
MOM groups incidents into Type A (higher fatality risk, such as falls from height, vehicular incidents and structural collapse) and Type B (more common, lower fatality risk, such as slips and trips). Both matter, for different reasons: Type A drives deaths, Type B drives the volume of injuries.
In 1H2026, according to the 1H2026 report:
- Type B slips, trips and falls on the same level were the largest category, with 19 cases.
- Type A falls from height followed, with 9 cases.
- Overall Type A incidents in construction fell from 49 to 38 against 1H2025, while Type B incidents rose from 26 to 31.
That shift is worth reading carefully. High-severity events are declining, which suggests that the controls aimed at the most dangerous work are having an effect. The rise in Type B incidents points to housekeeping, access routes, walkway condition and material storage, which are everyday site-management matters rather than specialist engineering problems.
Across all industries in 2025, The Straits Times reported that vehicular incidents were the top cause of workplace deaths (15 deaths, 42% of the total), followed by falls from height (7), collapse or failure of structures and equipment (6) and being struck by falling or moving objects (4). Construction sites feature heavily in the last three. For earlier context, in 1H2024 slips, trips and falls, machinery incidents and falls from height caused 59% of major injuries, and construction and manufacturing together accounted for 46% of the 293 major injuries.
A recent case shows how a single maintenance step becomes a fatal one. A 35-year-old worker died on 11 September 2026 after being struck by a compressed-air hose at a construction site along Jurong Port Road. MOM ordered a stop to all concreting works at the site and reminded occupiers that compressed air systems must be isolated and depressurised before hoses are disconnected. A hazard register that lists such energy sources, and a permit step that enforces isolation, are the kind of control that statistics like these point towards. Our guide to construction hazard examples every Singapore site must address walks through the common ones.

Where the injuries concentrate: smaller-scale works
The most useful structural finding in the recent reports is the split by project scale. In 1H2026, smaller-scale construction works accounted for 70% of the sector’s fatal and major injuries, while injuries at regular construction worksites fell from 26 to 19. In full-year 2025, smaller-scale works contributed 64% of the sector’s injuries (95, down from 103 in 2024), while regular worksites fell from 60 to 45.

Smaller-scale works are typically shorter jobs such as renovation, alteration and addition, and minor building works. They often have fewer dedicated safety staff, shorter planning time and rotating subcontractors. MOM’s 2025 report states that MAST will continue exploring upstream measures under the ongoing review of the bizSAFE framework, placing greater emphasis on companies’ WSH performance and targeting small-scale works that account for more than 60% of sector injuries.
For a contractor, that direction of travel has a practical consequence: your bizSAFE standing is likely to be read increasingly alongside your actual injury record. Preparing for bizSAFE Level 3, Level 4 and Star is therefore better treated as an operating discipline than a certificate to collect.
Public versus private projects
In a written parliamentary reply on 4 November 2026, MOM gave the split of the sector’s fatal and major injuries between public and private projects:
| Year | Public-sector projects | Private-sector projects |
|---|---|---|
| 2023 | 39% | 61% |
| 2024 | 43% | 57% |
| 2025 | 37% | 63% |
Private projects account for the larger share each year, so improvement cannot rest on public-sector procurement rules alone. The same reply explains that MAST has extended the Safety Disqualification framework to all levels of contractors for public-sector tenders above $1 million, and that poor-performing contractors across all construction projects face the Demerit Point System and the Business Under Surveillance programme. In practical terms, a poor safety record now has commercial consequences, including tender eligibility.
Technology is part of the response as well. Minister of State for Manpower Dinesh Vasu Dash said that AI-enabled video analytics were trialled with CCTV at 14 construction sites, and that MOM will work with BCA and public-sector agencies to make video analytics compulsory for public-sector construction projects after the pilot (The Straits Times, 25 March 2026). Enforcement-led reporting is not unique to Singapore: regulators elsewhere also publish regulatory action on equipment safety, which gives a useful reference point when you compare how safety performance is documented over time.
Turning the statistics into a compliance plan
National figures describe the sector. Your obligations are specific to your sites. Five steps connect the two.
- Benchmark your own record against the sector rate. Compute your injuries per 100,000 hours or workers over the same period and compare it with MOM’s published sector rate. The figure to beat is the sector’s own, taken from the latest report.
- Rank hazards by severity and by frequency. The data says falls from height drive deaths and slips, trips and falls drive volume. Your hazard register should treat both, with controls at the top of the hierarchy (elimination, substitution, engineering) before personal protective equipment.
- Treat small jobs as full projects. If 64% to 70% of serious injuries come from smaller-scale works, a short renovation needs a risk assessment, a competent supervisor and a permit regime in the same way a tower does.
- Design out risk early. Many Type A hazards, such as work at height and lifting, are fixed or created at the design stage. This is the purpose of Design for Safety, which asks designers and developers to identify and reduce risk before construction starts.
- Verify controls with an independent audit. A WSH audit and inspection tests whether the procedures on paper are the ones carried out on site. For tenders where safety performance is scored, ConSASS assessments show how your safety management compares.
If an incident does occur, reporting duties start quickly. Our guide to reporting workplace accidents in Singapore sets out what employers must notify and when, and our overview of construction accidents in Singapore covers what workers and employers need to know afterwards.
Our perspective
The 2025 and 1H2026 figures show that the sector can move quickly when ownership, enforcement and attention align. They also show where the next gains lie. Deaths are falling, but the rise in slips, trips and falls, and the weight of smaller-scale works in the injury count, tell us that the remaining risk is found in routine site management rather than in dramatic failures.
Our work across more than 20 years is built on that reading. We tailor Quality, Environment and Safety solutions to each client’s projects, and we continue to support clients after the engagement, because a safety system that is not maintained drifts back towards the sector average. Certification through bizSAFE or ISO, a Design for Safety review, a WSH audit and a ConSASS assessment each address a different point in the project life cycle, and they work best when they are planned together instead of purchased one at a time before a tender deadline.
The direction of regulation is clear: performance, not paperwork, will increasingly define eligibility. Firms that build their record on genuine controls will find each new requirement an extension of what they already do.
Aman
Support for contractors who want their numbers to improve
MOSAIC Ecoconstruction Solutions provides Quality, Environment and Safety consultancy and training for the construction sector, including bizSAFE and ISO certification support, WSH audits, Design for Safety, ConSASS, EHS advisory and documentation, and EHS manpower outsourcing. If the statistics above point to a gap in your own programme, whether on small-scale works, hazard control or tender readiness, you can contact our team through the MOSAIC website to discuss which service fits your projects.

For everyday site practice, our construction site safety tips for Singapore and our guide to workplace safety management systems in the construction industry are practical starting points.
FAQ
How many construction workers died in Singapore in 2025?
Construction recorded 13 workplace deaths in 2025, the most of any industry, down from 20 in 2024. The sector’s fatal injury rate fell from 3.7 to 2.3 per 100,000 workers, according to MOM’s 2025 WSH Report.
What is the main cause of construction injuries in Singapore?
In 1H2026, the largest category was Type B slips, trips and falls with 19 cases, followed by Type A falls from height with 9 cases. Falls from height remain the main cause of construction deaths, which is why work at height controls and Design for Safety review carry so much weight.
Where can I find the official construction accident statistics?
MOM publishes the half-year and annual Workplace Safety and Health Reports, with sector tables for deaths, major injuries and rates. The 1H2026 report was released on 8 September 2026, and the annual report is normally published in the first quarter of the following year. Check MOM’s WSH statistics page for the latest edition, since figures are updated with each release.
Do smaller construction projects have more accidents?
Smaller-scale works accounted for 70% of the sector’s fatal and major injuries in 1H2026 and 64% in 2025, according to MOM. That is why MAST is looking at upstream measures, including the bizSAFE framework review, aimed at small-scale works.
Sources
- Release of 1H2026 WSH Report, MOM
- Workplace Safety and Health Report January to June 2026, MOM
- Workplace Safety and Health Report 2025, MOM
- 2025 WSH Report press release, MOM
- 2024 WSH Report press release, MOM
- Singapore WSH performance in 1H2025, MOM
- Written answer on injury rates for public and private construction projects, MOM
- Two delivery riders among 36 workplace deaths in 2025, The Straits Times
- 19 workplace deaths in first half of 2024, The Straits Times
- Worker dies after being struck by hose at Jurong Port Road, The Straits Times
- Regulatory action on equipment safety
Recommended
- Construction accident Singapore: What workers and employers need to know
- The Ultimate Guide to Top 10 Workplace Hazards in Singapore: Manufacturing & Construction Focus (2025)
- MOM WSH Alerts: Workplace Safety Case Studies & Prevention
- File in 10 Days: Reportable Accidents in Singapore for Construction