
Introduction
ISO 50001 energy audit preparation no longer requires weeks of manual spreadsheet compilation and fragmented data gathering. By combining IoT telemetry with LLM summarization, organizations can transform raw energy data into structured, audit ready documentation that satisfies all 31 distinct clause requirements of ISO 50001-automatically and continuously. Digital platforms can cut audit preparation time by 84%, turning what was once a reactive scramble into a proactive energy intelligence system.
This article focuses on construction facilities, industrial sites, and commercial buildings pursuing ISO 50001 compliance in Singapore and Southeast Asia. The target audience includes EHS managers, facility managers, and compliance officers in construction and manufacturing companies who need to streamline their audit process while demonstrating continuous improvement in energy performance.
The core answer: Combining IoT sensors for continuous monitoring of energy consumption with large language models for automated reporting creates a centralized system that tracks energy performance indicators, identifies significant energy uses, normalizes energy baselines, and generates audit ready evidence-reducing manual effort by up to 75% and compressing ISO 50001 certification timelines from years to as few as 18 to 22 weeks with digital tools.
After reading this article, you will understand:
-
How IoT telemetry delivers the granular data foundation ISO 50001 auditors require
-
How LLM summarization converts complex energy data into audit ready documentation
-
A practical integration framework mapping IoT outputs to specific ISO 50001 clauses
-
A phased implementation roadmap for construction and industrial facilities in Singapore
-
Solutions to common challenges including data quality, LLM accuracy, and system integration

Understanding IoT Telemetry and LLM Summarization in Energy Management
Efficient energy management under ISO 50001 demands two capabilities that traditional approaches struggle to deliver simultaneously: continuous, high-resolution energy data collection and the ability to interpret that data into meaningful narratives for auditors and decision-makers. IoT telemetry and LLM summarization address each of these requirements while also supporting stronger building performance and tighter operational control, forming the backbone of a modern energy management information system.
ISO 50001 requires reliable, consistent, and traceable data. The standard’s structured framework spans energy reviews, baseline establishment, significant energy use identification, and performance monitoring-all demanding verifiable evidence. Auditors require verifiable evidence of energy performance in compliance with ISO 50001, meaning organizations need more than dashboards; they need documented proof that internal processes are functioning as designed and delivering ongoing improvements.
IoT Telemetry for Energy Data Collection
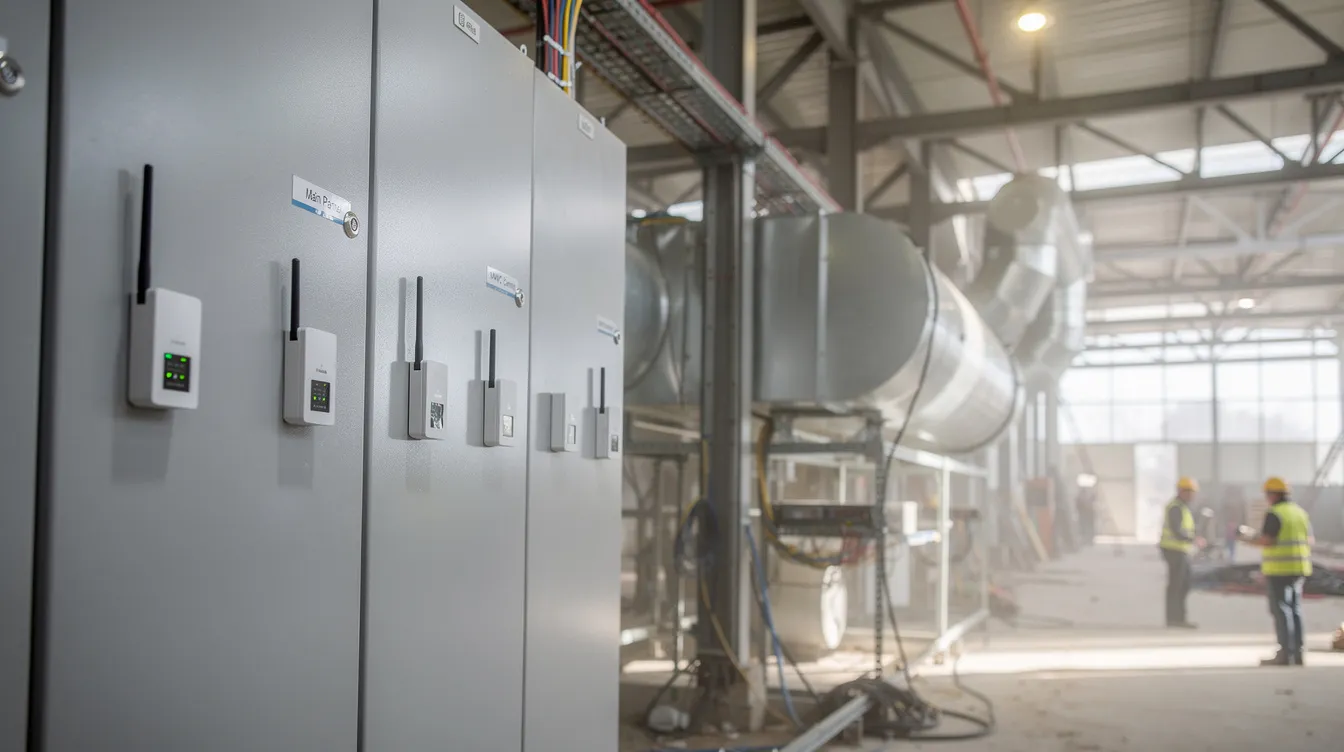
IoT telemetry refers to the continuous, automated collection of meter data from sensors deployed across construction sites, manufacturing floors, and commercial buildings. Non-invasive clamp-on sensors and smart sub-meters capture electricity consumption at intervals as frequent as every 15 minutes, providing equipment level data that reveals energy usage patterns invisible to monthly utility bills alone.
Granular data collection requires smart meters, sub-meters, and sensors for accurate energy accounting. In practice, this means instrumenting main electrical panels, major HVAC systems, lighting circuits, compressors, and production machinery. This level of sub-metering improves visibility into facility energy consumption, especially where cooling and process loads dominate total use. Wireless connectivity protocols-WiFi, LoRaWAN, or NB-IoT-enable data transmission from remote construction sites and multi-building industrial complexes where hardwired infrastructure is impractical.
These IoT deployments integrate with existing building management systems and supervisory control and data acquisition (SCADA) platforms to avoid creating data silos while supporting practical load management across connected building systems. EcoXplore’s deployment at large Singapore campus buildings, for example, involved sub-metering at panel level with real-time 15-minute data collection, replacing spreadsheet workflows and enabling consumption attribution that delivered approximately 8% month-on-month energy savings.
LLM Summarization for Energy Intelligence
Large language models process structured energy data and generate human-readable insights, recommendations, and audit documentation. This goes beyond conventional dashboards by producing narrative explanations of why energy consumption deviated from baselines, what equipment contributed to anomalies, and what corrective actions the facility should consider.
Automated audits should generate executive summaries highlighting energy performance and deviations. LLM summarization achieves this through two mechanisms: data-to-narrative generation (converting trend data and EnPIs into plain-language reports) and template-based documentation (mapping observed data to ISO 50001 clause structures). Research into LLM-based energy management interfaces demonstrates that these models can translate broad queries like “reduce HVAC energy overnight” into specific operational parameters, showing their capacity to bridge the gap between raw data and actionable compliance documentation.
Retrieval augmented generation (RAG) enhances accuracy by grounding LLM outputs in facility-specific context-past audit reports, ISO standard text, company policies, and prior management reviews-rather than relying solely on the model’s general knowledge. This approach is critical for reducing false positives and avoiding the hallucination risks inherent in general-purpose LLM deployments.
How these technologies integrate to create comprehensive energy management intelligence is where the real value emerges for ISO 50001 compliance.
Integration Framework for ISO 50001 Compliance
The power of combining IoT telemetry with LLM summarization lies in mapping continuous data streams directly to ISO 50001’s specific requirements. Standardized telemetry frameworks ensure audit-ready data, while LLM processing transforms that data into the documentation auditors expect. A structured data approach is needed for effective ISO 50001 audits-here is how each critical component works.
Automated EnPI Calculation and Monitoring
Energy performance indicators measure energy performance against objectives and baselines-and ISO 50001 requires traceable calculation methodologies for EnPIs. IoT sensors collect baseline energy consumption data that must be normalized for production output, weather conditions, and operational hours. Time-series data should be normalized for effective energy management analysis and reporting, particularly in Singapore’s tropical climate where high cooling loads and humidity create consistent but significant energy demand.
A study across ten Singapore buildings using hourly IoT data combined with XGBoost and LSTM models for dynamic baselining achieved 20–24% average energy savings in retrofitted buildings. One mixed-use building realized 1,200 MWh in annual savings-approximately SGD 185,000 in lower energy costs-with corresponding emissions reductions of roughly 1,161 tCO₂e.
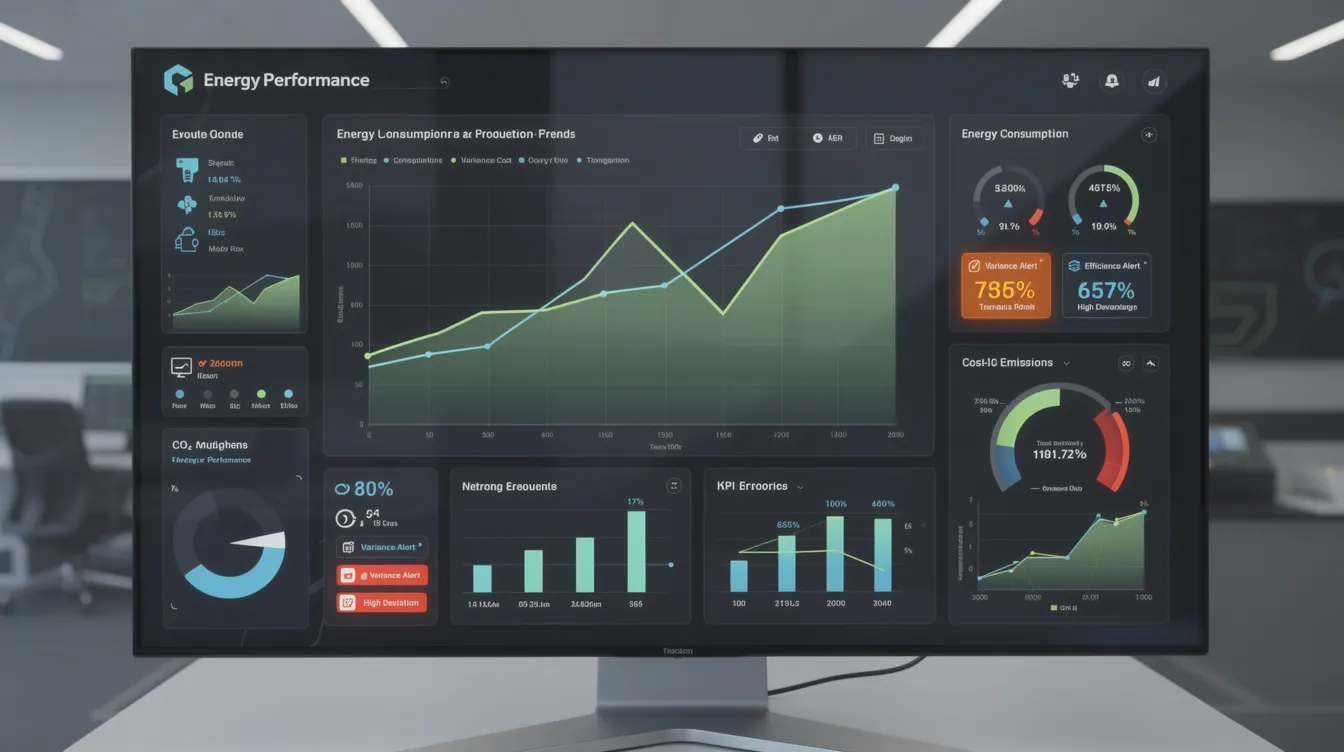
LLM analysis then generates monthly EnPI reports with variance explanations and improvement recommendations, providing the narrative layer auditors need alongside raw numbers. EnPI dashboards refresh continuously from connected meters and utility data, giving facility managers real-time visibility into whether current performance meets established targets. Digital tools provide continuous monitoring for energy performance indicators, ensuring nothing falls through the cracks between surveillance audits and making recurring energy audits faster because evidence is already structured and current.
Significant Energy Use (SEU) Identification and Tracking
Significant energy uses must be monitored and measured according to ISO 50001. Aggregated telemetry provides significant energy uses with essential performance context for ISO audits, enabling organizations to rank equipment and processes by absolute consumption, energy intensity per unit output, and savings potential.
Continuous monitoring of energy-intensive equipment-HVAC systems, lighting arrays, compressors, and heavy machinery across construction sites-feeds machine learning algorithms that identify consumption patterns and flag shifts in SEU rankings. Cooling systems represent the largest share of energy consumption in Singapore’s commercial buildings, making them a primary target for SEU tracking. In data center-adjacent or AI-intensive facilities, AI workloads can exceed rack power densities of 100 kW, which sharply increases the importance of cooling-related SEUs. When a compressor begins consuming 12% above its baseline during night shifts, the system detects the anomaly automatically.
LLM-generated monthly SEU reports highlight ranking changes and recommend optimization actions to reduce energy waste in high-load systems, creating the documented trail ISO 50001 auditors require. This documentation of energy performance improvement actions and results satisfies Clause 4.4.3 requirements while supporting the organization’s broader sustainability reporting obligations.
PDCA Cycle Documentation Automation
ISO 50001 emphasizes continuous improvement through the plan do check act cycle, and the IoT-LLM integration maps cleanly to each phase:
-
Plan: LLM analysis of historical energy data generates energy objectives, identifies improvement targets, and drafts action plans based on identified SEUs and EnPI trends
-
Do: IoT sensors track implementation progress with automated reporting on whether energy saving projects are delivering results as initially expected
-
Check: Real-time performance monitoring with variance analysis flags when outcomes deviate from plans, enabling corrective action recommendations before the next audit
-
Act: LLM-generated lessons learned and process improvement suggestions feed directly into the next cycle, helping organizations demonstrate continuous improvement with documented evidence
Automated energy baselines reflect current operating conditions, updating dynamically as operational context changes-a critical advantage over static annual baselines that can become stale within months of establishment. ISO 50001 certified organizations achieve 10–30% energy intensity reductions through this disciplined cycle of measurement, analysis, and action.
Implementation Roadmap for Construction and Industrial Facilities
Moving from concept to deployment requires a structured approach. ISO 50001 certification typically takes 18 to 22 weeks with digital tools-significantly compressed from traditional timelines. U.S. manufacturers report a 68% reduction in implementation time when leveraging digital platforms, and similar efficiencies apply to Singapore’s construction and industrial sectors.
Phase 1: IoT Infrastructure Deployment (Weeks 1–4)
This phase establishes the data foundation that every subsequent step depends on.
-
Conduct a preliminary energy review to identify critical monitoring points across facilities-map major energy uses, rank potential SEUs, and document production schedules and building systems
-
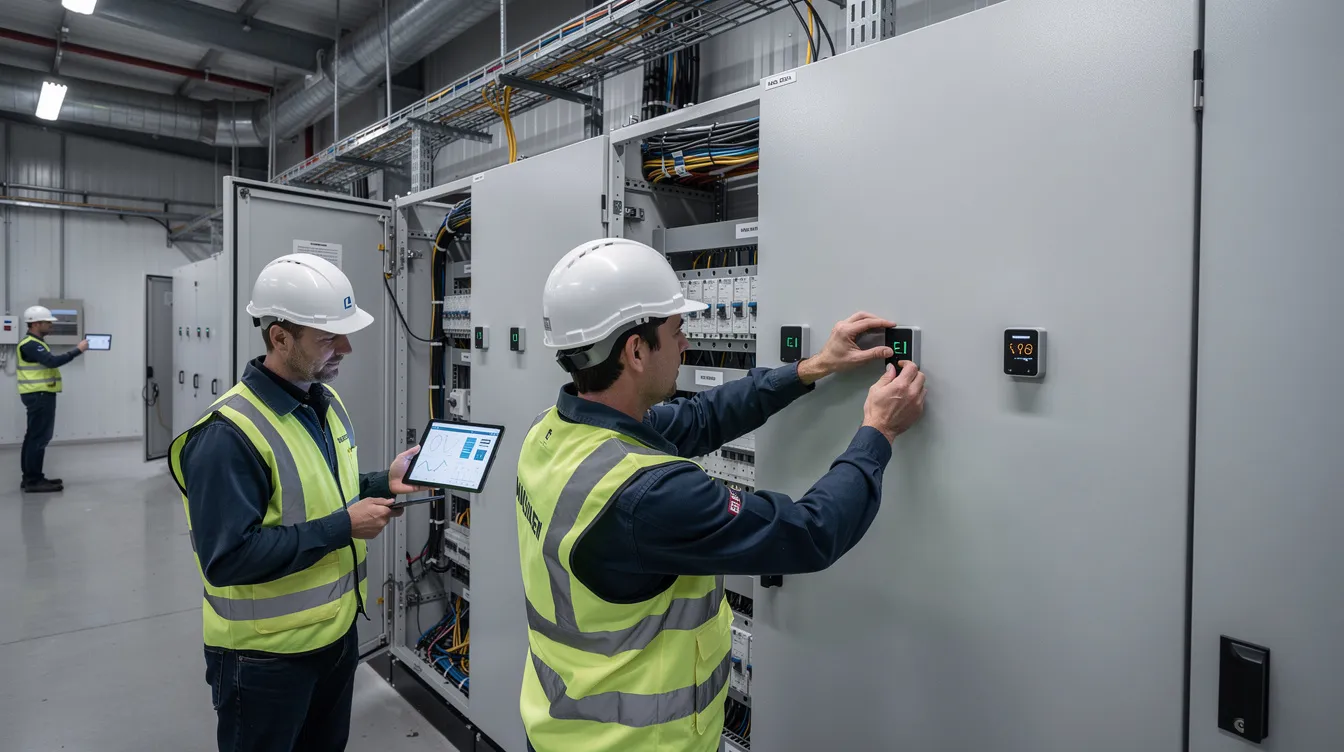
Install wireless IoT sensors on main electrical panels, major equipment (HVAC, compressors, motors), and energy distribution points; choose communication protocols appropriate to site conditions (LoRaWAN for remote construction sites, WiFi for stable indoor environments, NB-IoT for broad-coverage industrial complexes)
-
Configure data collection intervals at 15-minute resolution as a baseline compromise between sensitivity and data manageability; industrial processes with high energy demand may warrant sub-minute monitoring
-
Test connectivity and data quality across all monitoring points, implementing edge storage to buffer data during network interruptions and ensure no gaps in the audit trail
Governance in data collection and reporting is a necessary component of ISO 50001 compliance frameworks. Establish data validation protocols from day one-flagging anomalous readings for manual verification and maintaining calibration records for all sensors.
Phase 2: LLM Integration and Baseline Establishment (Weeks 5–8)
-
Deploy a cloud-based LLM platform configured for energy data analysis and ISO 50001 reporting; platforms like etaONE or Wattnow offer pre-built modules for EnPI tracking and automated reporting
-
Configure RAG workflows with facility-specific context: past energy reviews, operational schedules, ISO 50001 clause requirements, and company energy policies to ground LLM outputs in accurate data
-
Establish energy baselines using a minimum of 12 months of normalized consumption data incorporating weather conditions, production volumes, occupancy patterns, and operational hours
-
Configure automated report generation aligned with ISO 50001 documentation requirements, ensuring outputs map to specific clauses (energy review 4.4, baseline 4.4.2, SEU identification 4.4.3, EnPIs 4.4.4, monitoring and analysis 4.5)
Standardized data simplifies ISO 50001 audit preparation. Ensure that all utility inputs, meter data, and contextual variables follow consistent formatting across multiple facilities or sites.
Phase 3: Audit Readiness Validation (Weeks 9–12)
-
Generate comprehensive audit trail documentation using LLM-processed IoT data-the audit evidence pack should include energy performance summaries, corrective actions, and management reviews
-
Conduct an internal audit using automated evidence packages, validating that all 31 clause requirements have corresponding documentation and data support while confirming readiness for formal energy audits
-
Validate EnPI calculations and SEU rankings against ISO 50001 requirements, ensuring traceable methodologies and normalized baselines
-
Refine reporting templates and alert configurations based on internal audit feedback, preparing for initial certification by the external auditor
Best practices for ISO 50001 compliance include maintaining a data governance framework and audit logs. Every LLM-generated summary must link back to underlying telemetry data, maintaining the evidence chain auditors expect. Organizations operating in Europe may also align evidence packages with the Energy Efficiency Directive and the EU Energy Efficiency Directive when ISO 50001 is used to meet regional compliance expectations.
Common Implementation Challenges and Solutions
Deploying IoT telemetry and LLM summarization across Singapore’s construction sites and industrial facilities presents specific obstacles. Understanding these challenges upfront prevents costly rework and ensures the system delivers reliable audit ready evidence from the start.
Data Quality and Connectivity Issues
Sensors may drift, fail, or suffer from wireless network dropouts-particularly on temporary construction sites where infrastructure changes frequently. Data gaps undermine baseline stability and can trigger non-conformity findings during surveillance audits.
Solution: Deploy redundant connectivity options across sites. The following comparison helps facility managers select appropriate technologies:
|
Factor |
WiFi |
LoRaWAN |
NB-IoT (Cellular) |
|---|---|---|---|
|
Range |
50–100m indoor |
2–15 km |
Carrier coverage |
|
Reliability |
Moderate (interference) |
High (low bandwidth) |
High |
|
Cost per sensor/year |
Low |
Low–Medium |
Medium |
|
Best fit |
Stable indoor facilities |
Remote/outdoor sites |
Multi-building campuses |
|
Data resolution support |
Sub-minute capable |
15-min+ recommended |
5-min+ capable |
Implement edge storage so that data is buffered locally during outages, and deploy data validation algorithms to identify anomalous readings requiring manual verification. Accurate data depends on both reliable hardware and robust software checks working in concert.
LLM Training and Accuracy Challenges
LLM summarization carries the risk of generating plausible but incorrect narratives-misinterpreting energy data, over-generalizing trends, or even hallucinating audit clause references. Auditors in Singapore have expressed clear preference for evidence that is raw and auditable alongside any AI-generated summaries, meaning LLM outputs must augment rather than replace source data.
Solution: Establish a minimum 6-month data collection period before implementing LLM analysis to ensure an adequate training dataset. Implement human-in-the-loop validation for critical audit documentation and EnPI calculations. Use structured prompt templates tied to specific ISO clauses and embed source references in every generated summary-for example, “Compressor 2 energy usage increased 12% above baseline during night shift (Reference: Panel 3B, 15-min interval data, 14–22 July 2026).” This approach supports track corrective actions transparency while reducing unverified savings claims.
Integration with Existing Energy Management Systems
Many Singapore industrial facilities already operate building management systems, SCADA platforms, and utility bill management software. Creating yet another data silo defeats the purpose of a centralized system for efficient energy management.
Solution: Develop API connections to existing BMS, SCADA, and facility management platforms. Platforms like Proxus and ABB Ability EMS specialize in data integration across disparate sources, normalizing utility data and production metrics into consistent formats. Create data mapping protocols ensuring that total facility consumption, equipment-level breakdowns, and contextual variables maintain consistent formatting regardless of source system.
ISO 50001 emphasizes continuous improvement through standardized data-the integration layer is what makes that possible across multiple facilities and building systems.
Conclusion and Next Steps
Combining IoT telemetry with LLM summarization transforms ISO 50001 audit preparation from a periodic documentation exercise into a continuous energy intelligence capability. Organizations gain automated energy baselines that reflect current operating conditions, real-time EnPI tracking that flags deviations before they become audit findings, and LLM-generated documentation that maps directly to ISO 50001’s 31 clause requirements. ISO 50001 certification can reduce energy intensity by 10–30%, and digital tools reduce ISO 50001 implementation time by 68%, making this approach both operationally and financially compelling for Singapore’s construction and industrial sectors.
Immediate actionable steps:
-
Conduct an energy monitoring assessment to identify critical measurement points and existing data gaps across your facilities
-
Select IoT sensor technology appropriate to your site conditions-considering connectivity requirements for remote construction sites versus established industrial buildings
-
Evaluate LLM platforms with built in measurement and ISO 50001 reporting capabilities, prioritizing those offering RAG workflows and human-in-the-loop validation
-
Engage an ISO certification consultant experienced with digital energy management systems to align your implementation with auditor expectations
Organizations already pursuing integrated management systems (ISO 9001, 14001, 45001) will find that the IoT-LLM infrastructure for ISO 50001 creates a data foundation applicable to broader corporate sustainability and ESG reporting. As the International Energy Agency continues to emphasize improving energy efficiency as a cornerstone of decarbonization-and as data centers consumed around 415 TWh of electricity in 2024 with ISO 50001 adoption below 15% in the data center industry-the opportunity for organizations to lead through validated energy management practices has never been more significant.
Additional Resources
-
ISO 50001:2018 clause mapping: Each of the standard’s 31 requirements can be mapped to specific IoT data streams and LLM reporting templates-organizations should create this mapping document early in implementation to validate energy saving projects against specific clauses
-
ROI benchmarking: A cross-industry study across ten factories found AI-driven energy methods achieved average ROI in approximately 0.46 years versus 6.22 years for non-AI equipment interventions, though absolute energy savings per facility were larger for hardware changes (~1,231,600 kWh/year versus ~106,000 kWh/year for AI methods)
-
Singapore regulatory alignment: BCA’s Building Energy Benchmarking requires buildings ≥ 5,000 m² to submit annual energy use intensity data-IoT telemetry systems can automate this reporting alongside ISO 50001 documentation
-
Singapore case studies: HSL Constructor achieved approximately 26% annual cost savings (electricity and diesel) after ISO 50001 certification, maintaining primary energy consumption within 1% above baseline despite operational growth; Keppel Infrastructure used continuous monitoring to contextualize operational data against baselines and detect abnormalities through ongoing energy reviews
-
Contact MOSAIC Safety for ISO 50001 consultation services tailored to Singapore construction and industrial facilities, including audit preparation guidance and management system implementation support